Download

1 / 33
340 likes | 574 Vues
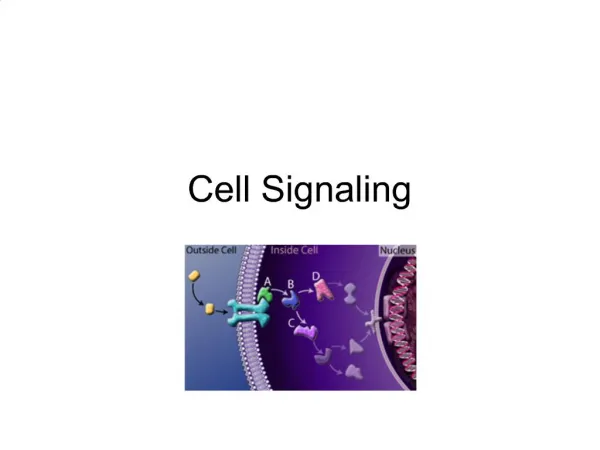
Quantitative Models of Mammalian Cell Signaling Pathways. Ravi Iyengar, Ph.D. Department of Pharmacology and Systems Therapeutics Mount Sinai School of Medicine. Quantitative Modeling Mathematical Models of Regulatory Motifs in Signaling Networks.

E N D
Quantitative Models of Mammalian Cell Signaling Pathways Ravi Iyengar, Ph.D. Department of Pharmacology and Systems Therapeutics Mount Sinai School of Medicine
Quantitative Modeling Mathematical Models of Regulatory Motifs in Signaling Networks How do we understand the functions of regulatory configurations ? Integrating experiments and mathematical models What do mathematical models do for us ? Help identify hidden assumptions (Marder 2000) Sort through possible mechanisms Defines limits of generalization (Marder 2000)
Why we need mathematical models to understand biological systems Weng, Bhalla and Iyengar, Science.284, 92 (1999).
Different Types of Models Ordinary Differential Equation Models (ODE Models) Partial Differential Equation Models (PDE Models) Stochastic Models
Choosing the right mathematical representation System:A network of interacting adrenergic receptors pathway Key Question:Is there an NE triggered MAPK switch? Modeling Approach:systems of coupled ordinary differential equations (ODEs) … … … An ODE Model
Choosing the right mathematical representation System: A spatial model for Ras activation In different cellular organelles Key Question: What is the temporal characteristic of Ras activation in different cellular compartments? Modeling Approach: Reaction-diffusion model of Ras activation … … … A PDE Model
kf A + B AB kb kf A+B C+D kb k3 k1 E+S ES E+P k2 Modeling Signaling Networks using Ordinary Differential Equations All signaling reactions can be described in three types of interactions: • Ligand-Protein Interactions • Protein-Protein Interactions • Enzymatic Reactions
(1) (2) (1) (4) (2) (5) (6) (3) (3) (4) (5) (6) Model constructed using pair-wise interactions and solving ordinary differential equations Chemical steps
Model Components Count Molecules 64 Reactions (Binding and Enzymes) 105 Enzyme activities 34 Differential equations 90 Pathways from EGFR to MAPK and PLCg Simulation closely matched published experimental data Bhalla & Iyengar, Science.283, 381 (1999).
Emergent Property of MAPK Signaling Network: Bistability (Switching Behavior) Bistable: Two stable states - ON or OFF System exhibits thresholding effect Sharp transition curve between the two states Bhalla & Iyengar, Science.283, 381 (1999).
Experimental System Fibroblast (NIH-3T3) cells in culture A well characterized system for studying growth factor regulation of proliferation and oncogene screening model Basic experimental design Serum starve NIH-3T3 cells 16-20 hrs Stimulate with PDGF for 5 min Wash cells Incubate for desired times Assay for MAPK activity Does a brief pulse of PDGF result in sustained activation of MAPK?
PDGF-R Shc Grb2 SOS Ras PKC Raf-1 Sustained MAPK AA MEK 5 - 30 10 15 P-MAPK 2 MAPK 1,2 PLA2 Phospho-MAPK 2 (arbitrary units) Transient MAPK 5 - 15 30 P-MAPK 2 0 10 20 30 Time after wash (min) Transient response in a linear signaling pathway versus a sustained response in a signaling network
Time after wash (min) - 5 15 30 40 50 60 PDGF-R P-MAPK 2 Shc Grb2 SOS 0.15 PKC 0.1 Ras Activated MAPK (mM) AA Phospho-MAPK 2 (arbitrary units) 0.05 PLA2 Raf-1 0 0 10 20 30 40 50 60 0 15 30 45 60 Time (min) Time after wash (min) MEK MAPK 1,2 Sustained phospho-MAPK levels after brief PDGF stimulus Stim Wash Assay
100 PKC PDGF-R MAPK activity (% max) Shc 50 Grb2 SOS AA 0 Ras 0 10 20 30 40 Time (min) PLA2 Raf-1 Control Time after wash (min) MEK 5 - 30 10 15 P-MAPK 2 MAPK 1,2 Phospho-MAPK 2 (arbitrary units) AACOF3 50 mM Time after wash 5 - 15 30 P-MAPK 2 0 10 20 30 Time after wash (min) cPLA2 activity is necessary for sustained MAPK activity
100 PDGF-R MAPK activity (% max) Shc 50 Grb2 SOS BIM1 10mM Control Ras 0 Time after wash (min) Time after wash (min) 5 5 0 10 20 30 40 15 15 30 30 Raf-1 Time (min) MEK MAPK 1,2 Phospho-MAPK 2 (arbitrary units) - - P-MAPK 2 P-MAPK 2 0 10 20 30 Time after wash (min) PKC activity is necessary for sustained MAPK activity PKC AA PLA2
Transient MAPK activation Sustained MAPK activation Differential biological consequence of sustained versus transient activation of MAPK signaling Murphy et alNat Cell Biol 4, 556 (2002).
Ca2+ K+, Na+, Ca2+ Ca2+ + CaM K+, Na+, Ca2+ CaMKII Consequences of Networking: A Gate Long-Term Potentiation at the CA3-CA1 synapse in the hippocampus A process by which individual neurons change their responses based on prior activity. Many signaling pathways are involved including the four major protein kinases Protein kinase A, Protein kinase C, MAPK, and Calmodulin Dependent Kinase II CaMKII is the signaling protein kinase. Hypothesis: Other protein kinases are regulatory
Gating Pathway NMDAR AC1, 8 Ca2+/CaM cAMP Calcineurin (PP2b) Signal Pathway PKA PP1iI1-P PP1a + I-1 CaMKII-P AMPAR Increased Synaptic Response (LTP)
Using models to develop experimental hypotheses to understand complex signaling mechanisms
Glutamate AMPAR NMDAR mGluR G Gating pathway PLC Ca2+ GEF IP3 DAG AC 1/8 PDE CaM CaMKII AC2 Ras Ca2+ PKC CaN AA Raf cAMP MEK 1,2 PKA PP1 Signal Pathway PLA2 MAPK 1,2 MKP Feedback loop Regulation of Nuclear and Cytoskeletal Events
Regulation of a signaling pathway by a gate coupled to a positive feedback loop
Glutamate AMPAR NMDAR mGluR G Gating pathway PLC Ca2+ GEF IP3 DAG AC 1/8 PDE CaM CaMKII AC2 Ras Ca2+ PKC CaN AA Raf cAMP MEK 1,2 PKA PP1 Signal Pathway PLA2 MAPK 1,2 MKP Feedback loop Regulation of Nuclear and Cytoskeletal Events
Thio-phosphorylated Inhibitor-1 Protein does not restore the LTP blocked by MEK inhibitor PD-98059 80 60 40 EPSP SLOPE (%Baseline) 20 0 -20 Vehicle PD-98059 TPS + Inhibitor-1
Can MAPK prolong the CaMKII signal by some other mechanism? E.g., through transcriptional or translational control
MAPK-Dependent Expression of CaMKII During TPS-ISO-Induced LTP 100 * TOTAL CaMKII (% above control) 50 PD PD 0 SH 15 15 60 60 TPS-ISO * 50 TOTAL CaMKII (% above control) 25 0 S 2 15 60 TIME (min after TPS) CaMKII Actin SH +PD TPS-ISO 60
LTP and Increased CaMKII Expression Require Transcription and Translation Total CaMKIILTP 140 30 Act-D Aniso Act-D Aniso * * 120 10 * TOTAL CaMKII (% change from controls) EPSP SLOPE (% baseline) * -10 100 80 -30 TPS-ISO 60 TPS-ISO 60
50 0 S 60 100 * 50 PHOSPHO-CaMKII (% change from controls) Fractional pCaMKII 25 0 SHAM TPS-ISO 60 -25 Phospho-CaMKII Levels Remain Elevated For 60 min After TPS-ISO 100 PHOSPHO TOTAL 0 S 60 P-CaMKII Actin CON SH TPS-ISO 60
Glutamate AMPAR mGluR NMDAR G Gating pathway PLC Insertion, Phosphorylation Ca2+ GEF IP3 DAG AC 1/8 PDE CaM CaMKII Ras Ca2+ PKC CaN AA Raf cAMP MEK 1,2 PKA PP1 Signal Pathway PLA2 MAPK 1,2 MKP Transcriptional and Translational Control
Conclusions Mathematical models can generate hypotheses that can be experimentally tested. Mathematical models can help understand emergent behavior.