SBDCNet: Empowering Small Businesses with Research and GIS Support Across America
130 likes | 248 Vues
In FY2011, SBDCNet successfully handled 5,589 research requests from various regions outside the Southwest Texas Border, complementing an additional 1,612 requests from that area. By utilizing advanced technologies such as online forms, databases, and Geographic Information Systems (GIS), SBDCNet provides valuable insights into competitive landscapes and market potential. Their services span various industries from manufacturing to high-tech and food services. SBDCNet aims to assist entrepreneurs in understanding customer demographics and spending patterns, enhancing their business strategies.

SBDCNet: Empowering Small Businesses with Research and GIS Support Across America
E N D
Presentation Transcript
BIDC Austin, TX May 2014
SBDCNet Supports Small Businesses Across America SBDCNet Research Requests by State, FY2011 To highlight the operational reach of SBDCNet, this chart only depicts the 5,589 research requests coming from outside the Southwest Texas Border region. SBDCNet completed an additional 1,612 research requests for the SWTB region in FY11.
Which Industries Do We Cover? …to Mining… …to High-Tech… From Manufacturing… …to Food… …to Services… …to Medical and more! We use many technologies to process each request, including online submission forms and email, proprietary and public online databases, customized Content Management Systems (BARNI), and Geographic Information Systems.
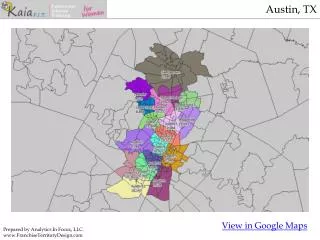
GIS Map: Competitor Locations • Usage Tips • Show competitors in relation to SBDC client’s location • Circle size can be customized for your client • Great way to help SBDC clients understand their competitive landscape and pinpoint opportunities
GIS Report: Competitor List (partial listing) • Usage Tips • Provides details about client’s competitors, including: company name, location, number of employees at each location, whether the location is a competitor’s single location or branch, estimated annual sales volume, the competitor’s NAICS and SIC code and a latitude and longitude coordinate.
GIS Map: Population Density • Usage Tips • Show population by zip code • Darker color = more people • Great to use with SBDC clients who want to know how many potential customers live in their target market
GIS Map: 10 Minute Drive Time • Usage Tips • Show drive times to client location • Irregular black line shows time boundaries • Great to use with SBDC clients to help them gauge their accessibility to their targeted customers
GIS Map: Average Incomes Inside 20 min. • Usage Tips • Show average household income by counties and drive times to client’s location • Darker color = more income • Irregular black line shows 20 minute drive time area (inside line) • Helps clients understand income patterns around a location
GIS Map: Consumer Expenditures • Usage Tips • Shows estimated consumer spending levels for a client’s industry in each zip code • Very useful for a client to see where the greatest potential demand is for their business.
GIS Report: Consumer Expenditure Comparison • Usage Tips • Shows average household annual expenditures on different types of industries. It also provides data on number of households and income levels. • Helps clients evaluate the relative demand for their chosen industry within their local market area, county, state and the nation.
GIS Report: Retail Sales Potential • Usage Tips • Useful for getting a broad demographic profile for an area as well as potential sales for a particular type of business • Includes general data on population, households and income • Bulk of data in report shows potential retail sales across different industries in both aggregate dollars and an index value • Index values greater than 100 mean that an industry at this location should enjoy relatively more consumer demand than the national average • Helps clients gauge the amount of consumer demand for their business
GIS Report: Demographic Detail Comparison • Usage Tips • Shows wide variety of demographic indicators (population, households, income, housing units, employment, education, marital status, vehicles, etc.) • Gives current values and trend data for these indicators, and also provides comparisons between the local market, county, state and the nation. • Helps clients understand their target customer. Can also help clients with multiple locations see how their customers might vary in a new location.