Download
1 / 16
160 likes | 188 Vues
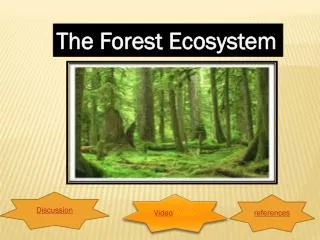
This research discusses forest ecosystem carbon in Russia, management issues, and ways to enhance it. Data on land distribution and age of trees are analyzed.

E N D
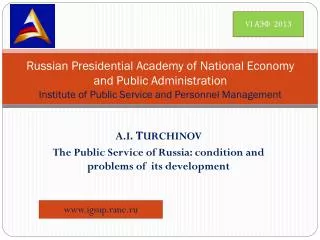
PRESENT KNOWLEDGE OF FOREST ECOSYSTEM CARBON IN RUSSIA AND PROBLEMS OF ITS IMPROVING by Vladislav Alexeyev Maxim Markov Boris Rybinin Michael Tarasov Pavel Zimnitsky
Category of land Lands under management of different agencies, million ha Total Forestry Agricultural Towns & Industry Ecology Reserve million ha % Forested area 681,1 114,3 7,3 13,6 7,0 823,3 48,1 Agricultural lands, including croplands, ploughed fields and pastures for cattle & deers 63,0 439,8 26,3 1,4 19,5 550,0 32,2 Peatlands 78,6 13,2 1,9 1,9 11,2 107,5 6,3 Waters (rivers, lakes) 13,1 19,3 1,7 1,5 17,9 72,0 4,2 Towns & villages 1,7 3,5 7,1 0,0 0,1 12,4 0,7 Damaged lands 0,1 0,3 0,7 0,0 0,1 1,2 0,1 Other lands 6,2 53,2 9,7 10,0 46,1 125,3 7,3 Total 843,8 656,8 56,3 28,9 104,8 1709,9 100,0 49,3 38,4 3,3 1,7 6,1 100,0 DISTRIBUTION OF TERRESTRIAL AREAS OF RUSSIA BY CATEGORIES OF LANDS, (State Report…, 1995) Table 1.
Age of trees Growing stock, m3/ha Phytomass of stand, t/ha Other vegetation (understory) t/ha Boles (with bark) Leaves /needles Branches Roots Stand, total 20 46 21,2 6,72 7,2 7,1 42,22 3,26 30 78 36,1 5,98 7,2 10,5 59,78 3,70 40 111 51,6 5,54 7,5 13,5 78,14 3,92 50 150 69,9 5,76 9,0 17,6 102,26 4,30 60 188 87,9 5,82 10,2 21,3 125,22 4,40 70 224 105,0 5,89 11,9 25,2 147,99 4,08 80 257 120,8 5,99 12,5 27,8 167,09 5,13 90 287 135,3 6,18 14,0 31,0 186,48 5,52 100 311 147,1 6,20 14,7 33,3 201,30 6,00 110 330 156,6 6,17 15,3 35,1 213,17 6,33 120 347 165,2 6,09 15,7 36,8 223,79 6,47 130 360 171,9 6,06 16,0 38,0 231,96 7,03 140 367 175,9 5,91 16,1 38,6 236,51 7,20 AGE CHANGING OF PHYTOMASS IN FOREST ECOSYSTEMS OF SCOTS PINE IN SOUTHERN TAIGA OF EUROPEAN RUSSIA.LENINGRAD REGION, TREE STAND OF III SITE QUALITY CLASS (after Usoltsev,2002) Table 2a.
Age of trees Growing stock, m3/ha Phytomass of stand, % Other vegetation (understory) % of stand Boles (with bark) Leaves /needles Branches Roots Stand, total 20 46 50,2 15,9 17,1 16,8 100,0 7,7 30 78 60,4 10,0 12,0 17,6 100,0 6,2 40 111 66,0 7,1 9,6 17,3 100,0 5,0 50 150 68,4 5,6 8,8 17,2 100,0 4,2 60 188 70,2 4,6 8,1 17,0 100,0 3,5 70 224 71,0 4,0 8,0 17,0 100,0 2,8 80 257 72,3 3,6 7,5 16,6 100,0 3,1 90 287 72,6 3,3 7,5 16,6 100,0 3,0 100 311 73,1 3,1 7,3 16,5 100,0 3,0 110 330 73,5 2,9 7,2 16,5 100,0 3,0 120 347 73,8 2,7 7,0 16,4 100,0 2,9 130 360 74,1 2,6 6,9 16,4 100,0 3,0 140 367 74,4 2,5 6,8 16,3 100,0 3,0 FRACTIONAL DISTRIBUTION OF PHYTOMASS IN FOREST ECOSYSTEMS OF SCOTS PINE IN SOUTHERN TAIGA OF EUROPEAN RUSSIA. LENINGRAD REGION, TREE STAND OF III SITE QUALITY CLASS Table 2b.
Age of trees Growing stock, m3/ha Coefficients for converting of growing stock (m3/ha) to phytomass (t/ha) Other vegetation (understory) t/ha Boles (with bark) Leaves /needles Branches Roots Total tree stand 20 46 0,461 0,146 0,157 0,154 0,918 0,168 30 78 0,463 0,077 0,092 0,135 0,766 0,079 40 111 0,465 0,050 0,068 0,122 0,704 0,045 50 150 0,466 0,038 0,060 0,117 0,682 0,028 60 188 0,468 0,031 0,054 0,113 0,666 0,019 70 224 0,469 0,026 0,053 0,113 0,661 0,012 80 257 0,470 0,023 0,049 0,108 0,650 0,012 90 287 0,471 0,022 0,049 0,108 0,650 0,010 100 311 0,473 0,020 0,047 0,107 0,647 0,010 110 330 0,475 0,019 0,046 0,106 0,646 0,009 120 347 0,476 0,018 0,045 0,106 0,645 0,008 130 360 0,478 0,017 0,044 0,106 0,644 0,008 140 367 0,479 0,016 0,044 0,105 0,644 0,008 COEFFICIENTS FOR CONVERTING OF SCOTS PINE GROWING STOCK VOLUME (m3/ha) IN ECOSYSTEMS OF SOUTHERN TAIGA OF EUROPEAN RUSSIA TO PHYTOMASS (t/ha)LENINGRAD REGION, TREE STAND OF III SITE QUALITY CLASS Table 2c.
Age of trees Growing stock, m3/ha Coefficients for converting of growing stock (m3/ha) to carbon (t/ha) Other vegetation (understory) t/ha Boles (with bark) Leaves /needles Branches Roots Total tree stand 20 46 0,230 0,073 0,078 0,077 0,459 0,084 30 78 0,231 0,038 0,046 0,067 0,383 0,040 40 111 0,232 0,025 0,034 0,061 0,352 0,023 50 150 0,233 0,019 0,030 0,059 0,341 0,014 60 188 0,234 0,015 0,027 0,057 0,333 0,009 70 224 0,234 0,013 0,027 0,056 0,330 0,006 80 257 0,235 0,012 0,024 0,054 0,325 0,006 90 287 0,236 0,011 0,024 0,054 0,325 0,005 100 311 0,236 0,010 0,024 0,054 0,324 0,005 110 330 0,237 0,009 0,023 0,053 0,323 0,004 120 347 0,238 0,009 0,023 0,053 0,322 0,004 130 360 0,239 0,008 0,022 0,053 0,322 0,004 140 367 0,240 0,008 0,022 0,053 0,322 0,004 COEFFICIENTS FOR CONVERTING OF SCOTS PINE GROWING STOCK (m3/ha) IN ECOSYSTEMS OF SOUTHERN TAIGA OF EUROPEAN RUSSIA TO CARBON (t/ha) LENINGRAD REGION, TREE STAND OF III SITE QUALITY CLASS Table 2d.
Dominant tree species Age-class group Young stands Middle-aged Maturing Mature /overmature Class Ia Class IIb European Part of RussiaNorthern Taiga Scots pine 0.888 0.696 0.694 0.675 0.621 Spruce 1.144 0.750 0.736 0.732 0.684 Birch 1.106 0.840 0.834 0.894 0.864 Middle Taiga Scots pine 0.696 0.556 0.568 0.612 0.586 Spruce 0.880 0.686 0.678 0.686 0.649 Birch 1.034 0.744 0.750 0.806 0.778 Aspen 0.786 0.510 0.540 0.556 0.496 Southern Taiga and Forest Steppe Scots pine 0.696 0.556 0.568 0.612 0.586 Spruce 0.830 0.668 0.608 0.670 0.632 Birch 1.034 0.736 0.750 0.802 0.780 Aspen 0.786 0.540 0.540 0.558 0.496 COEFFICIENTS FOR CONVERSION THE VOLUME OF GROWING STOCK TO STAND PHYTOMASS FOR MAJOR TREE SPECIES IN ECOREGIONS OF RUSSIA(1994, extraction) Table 2e.
Age of tree stands Dominant species & Ecoregions 10 20 30 40 60 80 100 120 140 160 180 Pinus sylvestris Boreal zone Northern taiga 0,728 0,535 0,439 0,401 0,370 0,358 0,352 0,349 0,346 0,345 0,344 Middle taiga 0,562 0,436 0,375 0,351 0,333 0,326 0,323 0,321 0,320 0,319 0,319 Southern taiga 0,446 0,369 0,331 0,318 0,307 0,303 0,302 0,301 0,300 0,300 0,299 Mixed forests 0,367 0,325 0,303 0,295 0,289 0,287 0,286 0,286 0,286 0,285 0,285 Zone of deciduous hardwood forests 0,334 0,297 0,285 0,281 0,278 0,277 0,276 0,276 0,276 0,276 0,276 Picea Boreal zone Northern taiga 0,762 0,590 0,503 0,456 0,411 0,387 0,370 0,359 0,352 0,346 0,341 Middle taiga 0,700 0,535 0,455 0,414 0,374 0,354 0,342 0,334 0,328 0,324 0,320 Southern taiga & Mixed forests 0,658 0,498 0,423 0,386 0,350 0,333 0,323 0,317 0,313 0,309 0,306 Coefficients for conversion of growing stock volume (m3) to carbon (t) European part of Russia(2004, Extraction) Table 3.
Humidity of forest ecosystems Relative density of stands Age-class group Young stands Middle-aged Maturing Mature Overmature Class I Class II Excessively drained sites 0,5 & < 0,481 0,396 0,378 0,371 0,368 0,366 0,6 - 0,8 0,436 0,351 0,333 0,326 0,323 0,321 0,9 & > 0,411 0,326 0,308 0,301 0,298 0,296 Well and moderately well drained sites 0,5 & < 0,481 0,396 0,378 0,371 0,368 0,366 0,6 - 0,8 0,436 0,351 0,333 0,326 0,323 0,321 0,9 & > 0,411 0,326 0,308 0,301 0,298 0,296 Poorly drained sites 0,5 & < 0,481 0,396 0,378 0,371 0,368 0,366 0,6-0,8 0,436 0,351 0,333 0,326 0,323 0,321 0,9 & > 0,411 0,326 0,308 0,301 0,298 0,296 Detailed coefficients for transmission of growing stock volume (m3) to carbon (t)(Extraction for Scots pine forests in middle taiga of European Russia ) Table 4.
Dominant tree species Young stands Middle-aged Maturing Mature Over-mature Class I Class II Northern Taiga Scots pine 1,05 0,46 0,37 0,21 0,17 0,19 Spruce 1,23 0,56 0,21 0,16 0,11 0,13 Birch 1,55 0,64 0,19 0,04 0,02 0,04 Middle Taiga Scots pine 1,23 0,49 0,24 0,18 0,10 0,12 Spruce 1,26 0,62 0,26 0,15 0,05 0,07 Birch 1,14 0,62 0,23 0,08 0,04 0,10 Aspen 1,42 0,44 0,21 0,09 0,06 0,09 Southern Taiga Scots pine 1,48 0,20 0,17 0,09 0,07 0,10 Spruce 1,39 0,24 0,09 0,05 0,04 0,07 Birch 1,21 0,48 0,15 0,09 0,05 0,07 Aspen 1,78 0,69 0,14 0,08 0,05 0,06 CONVERSION COEFFICIENTS FOR TRANSFORMING VOLUME OF COARSE WOODY DEBRIS (CWD, m3/ha) OF FOREST ECOSYSTEMS IN EUROPEAN RUSSIA TO CARBON (t/ha) [after clearcutting] Table 5.
Components of forest ecosystem Age class group of stands Total Young I class Young II class Middle- aged Premature Mature & overmature Methodology-1994 Forest vegetation: Tree stand 2,01 4,79 25,27 23,55 21,28 76,9 Understory 3,4 Methodology-2004 Forest vegetation: Tree stand 2,01 4,79 25,27 23,55 21,28 76,9 Understory 0,1 0,2 0,9 1,0 0,9 3,1 CWD on the ground 3,0 0,96 4,30 2,12 1,81 12,19 CWD of roots Litter 1,77 2,3 9,33 7,73 12,7 33,83 Soil 12,86 8,39 22,65 16,92 19,88 80,7 Total 20,22 16,67 62,23 50,86 57,04 207,02 Carbon (Mt) of components in Scots pine forest ecosystems of Leningrad Oblast(after clearcutting) Table 6.
Ecoregion European Russia Asian Russia Total Western Siberia Middle Siberia Eastern Siberia and Yakutia Far East Gt t/ha Gt t/ha Gt t/ha Gt t/ha Gt t/ha Gt t/ha Plains Forest tundra zone 0,35 103 1,83 149 3,31 125 - - - - 5,4 130 Boreal zone Northern taiga subzone 4,93 137 3,75 181 3,78 113 - - - - 12,46 138 Middle taiga 5,1 137 7,86 191 4,71 193 10,11 149 - - 27,78 163 Southern taiga subzone 4,22 118 6,14 203 5,77 230 - - - - 16,13 177 Mixed forests 1,86 142 - - - - - - - - 1,86 142 Forest steppe zone 1,49 156 1,68 246 1,11 281 - - 1,18 204 5,46 208 Steppe zone 0,22 131 0,27 147 - - - - - - 0,49 136 Desert zone 0,02 136 - - - - - - - - 0,02 136 Subtotal 18,19 21,53 18,68 10,11 1,18 69,69 Mountains Subarctic zone 0,04 123 0,72 88 3,91 99 1,67 91 6,31 95 Boreal zone 1,01 125 3,94 171 7,73 123 9,87 156 22,55 143 Subboreal zone (Ural) 0,86 148 7,92 174 4,64 174 4,8 177 18,22 168 Subboreal (Caucasus) 0,79 239 0,79 239 Subarid zone 0,37 160 0,37 160 Subtotal 2,67 12,95 16,28 16,34 48,24 Total 20,86 21,53 31,63 26,39 17,52 117,93 CARBON STORAGE AND CARBON DENSITY OF FOREST ECOSYSTEMS IN GEOGRAPHICAL ECOREGIONS OF RUSSIA Table 7.
65 55 45 Average density C, t/ha 35 25 15 5 12.05.1905 1961 1966 1973 1978 1983 1988 1993 1998 Year of forest account Dynamic of average carbon density in deciduous softwood stands of European Russia by age groups: middle-aged maturing mature and overmature young stands
middle-aged maturing mature and overmature young stands Dynamic of average carbon density in coniferous stands of European Russia by age groups: 70 60 50 Average density C, t/ha 40 30 20 10 12.05.1905 1961 1966 1973 1978 1983 1988 1993 1998 Year of forest account
Conclusion 1. The Government of Russia did not take attention for research of the National terrestrial carbon up to October-2004. 2. Russia has no the National program for carbon research. 3. Developing of carbon research is restricted by (1) absence of funding for work and (2) not available for scientists of the State Forest Account-2003 4. Study and estimate of storage and dynamics of carbon in ecosystems of Russia is carry out by smallseparated groups of scientists (inside and outside of that country). Funding of these researchers is providing mainly for account of different grants. 5. Carbon storage of forest stands of Russia (in the National scale and for different geographical and administrative regions) is estimated to present time with error of ±10-20%. 6. Methodology of carbon estimation for forest ecosystems are in developing. The results of the first approximation was published by Alexeyev an Birdsey in 1994, the second – by IIASA in 2000. The third approximation is going to be published by Alexeyev and Birdsey in the spring of 2005 . 7. The single detail estimation of the full carbon balance for Russia was made by IIASA in 2000. Main conclusion of this study – a level of our carbon knowledge is insufficient for such calculations. Uncertainties of estimation give error over 100%.
Primary tasks for Russian carbon in 2005-2006 1. Organize and develop the National program for research of carbon in Russian terrestrial ecosystems. 2. Try to get a sufficient budget and private funding (including the International) for carbon ecosystem research 3. Change of the database aggregation in the State Forest Account for understanding of the climax forests, uneven aged stands, show absolute age of dominant tree species, show all site quality classes of stands, etc.). 4. More intensively to involve of the International science and scientists in research of carbon in forest ecosystems of Russia. 5. Organize in Russia the International Workshop devoted to research of Russian forest carbon.