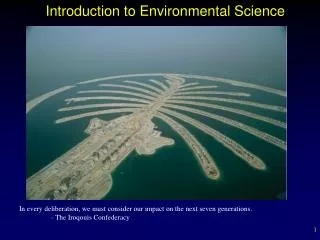
Introduction to Environmental Science
Introduction to Environmental Science. Chapter 6: Human Population and Urbanization. CASE STUDY. Are there too many of us?. 6-1 How many people can the Earth support?.

Introduction to Environmental Science
E N D
Presentation Transcript
Introduction to Environmental Science Chapter 6: Human Population and Urbanization
CASE STUDY Are there too many of us?
6-1 How many people can the Earth support? The human population has grown rapidly due to technology, improved medical techniques, emphasis on hygiene, and expansion of agriculture and industry. Population growth has slowed but is troubling because we do not know how long we can continue without overshooting earth's carrying capacity for humans. No population, including humans, can continue to grow indefinitely. "We do not know how long we can continue increasing the earth’s carrying capacity for humans without seriously degrading the life-support system that keeps us and many other species alive. "
Natural Capital Degradation Altering Nature to Meet Our Needs Reduction of biodiversity Increasing use of the earth's net primary productivity Increasing genetic resistance of pest species and disease-causing bacteria Elimination of many natural predators Introduction of potentially harmful species into communities Using some renewable resources faster than they can be replenished Interfering with the earth's chemical cycling and energy flow processes Relying mostly on polluting and climate-changing fossil fuels
3 Factors of Human Population Birth: Fertility Death: Mortality Migration: Emigration and ImmigrationPopulation increases through births and immigration and decreases through deaths and emigration. [Population change = (Births + Immigration) - (Deaths + Emigration)]1. The crude birth rate is the number of live births per 1,000 people in a population in a specific year. 2. The crude death rate is the number of deaths per 1,000 people in a population in a specific year. 6-2 What Factors Influence the Size of the Human Population?
FERTILITY Fertility is the number of births that occur to an individual woman or in a population. 1. The changing nature of fertility rates affect population growth. a. Replacement-level fertility is the number of children needed to replace their parents. b. Total fertility rate (TFR) is the average number of children that a woman has during her fertile years.
Factors Influence Birth and Fertility Rate 1. More children work in developing countries; they are important to the labor force. 2. The economic cost of raising and educating children determines their numbers. 3. If there are available private/public pension systems, adults have fewer children because they don't need children to take care of them in old age. 4. People in urban areas usually have better access to family planning, so have fewer children. 5. If women have educational and economic choices, they tend to have fewer children. 6. When the infant mortality rate is low, people have fewer children. 7. The older the age at which women marry, the fewer children they bear. 8. If abortions are available and legal, women have fewer children. 9. The availability of reliable birth control allows women to space children and determines the number of children they bear.
Factors that have caused a decline in death rates are the following: • Factors that have caused a decline in death rates are the following: 1. Better food supplies and nutrition, and safer water supplies contribute to people living longer. 2. Advances in medicine and public health, and improved sanitation and personal hygiene also contribute to people living longer.
Measures of overall health • 1. Life expectancy is the average number of years a newborn can expect to live. • 2. Infant mortality rate is the number of babies out of every 1,000 born who die before their first birthday. • a. This rate reflects a country's level of nutrition and health care. • b. It is the single best measure of a society's quality of life. • 3. U.S. infant mortality rate is higher than 40 other countries because: • a. Inadequate health care for poor women and for their babies. • b. Drug addiction among pregnant women. • c. High birth rate among teenagers.
Migration Historically, the United States has admitted more immigrants than all other countries combined. Some 60% of the U.S. population supports limiting legal immigration. A recent study suggests that to maintain a viable workforce as baby boomers retire, the U.S. would have to absorb many more immigrants per year than it currently does. However, a reduction in immigration may help mediate the enormous environmental footprint the United States currently has.
CASE STUDY THE U.S. POPULATION IS GROWING RAPIDLY
CASE STUDY THE UNITED STATES: A NATION OF IMMIGRANTS
• Immigration – legal and illegal – 39% population growth • 1820–1960: Most immigrants European • Since 1960 – Latin America – 53% – Asia – 25% – Europe – 14%
• Opponents of immigration – Stabilize population sooner – Reduce growing environmental impact – 60% of population favor reducing immigration • Proponents of immigration – Important historical role – Do menial jobs and pay taxes – Add cultural vitality – Replace retiring baby boomers
6-3 HOW DOES POPULATION'S AGE STRUCTURE AFFECT ITS GROWTH AND DECLINE? • GENERALIZED POPULATION AGE STRUCTURE DIAGRAMS
POPULATION AGE STRUTURE BY AGE AND SEX IN DEVELOPED AND DEVELOPING COUNTRIES
Some Problems with Rapid Population Decline Can threaten economic growth Labor shortages Less government revenues with fewer workers Less entrepreneurship and new business formation Less likelihood for new technology development Increasing public deficits to fund higher pension and health-care costs Pensions may be cut and retirement age increased
RISING DEATH RATE: THE AIDS TRAGEDY • 25 million killed by 2008 • Many young adults die: loss of most productive workers • Sharp drop in life expectancy • International community called upon to • Reduce the spread of HIV through education and health care • Financial assistance and volunteers
6-4 HOW CAN WE SLOW HUMAN POPULATION • Demographic transition stages • Preindustrial • Transitional • May lead to a demographic trap • Industrial • Postindustrial
FAMILY PLANNING • Information is given on birth spacing, birth control, and health care. • Family planning has been responsible for at least 55% of the drop in TFRs in developing countries. • Family planning has also reduced both legal and illegal abortions per year. • Services come through educational and clinical services. • Almost one-half of pregnancies in developing countries are unplanned and 26% end in abortion. • Women want to limit their pregnancies but have no access to contraceptives. • Empowering women by providing education, paying jobs, and support for their human rights can slow population growth. • Women work two-thirds of all the hours worked, but receive 10% of the world’s income.
CASE STUDY SLOWING POPULATION GROWTH IN CHINA
POPULATION GROWTH IN CHINA • One-child families • Halved birth rate and drastically reduce TFR • Improved quality of life • Strict family planning • Sons still preferred – gender imbalance
POPULATION GROWTH IN CHINA • Population rapidly aging • Rapidly growing economy • Larger middle class increases resource consumption and waste • Sustainable economic plan needed to avoid environmental degradation
CASE STUDY SLOWING POPULATION GROWTH IN INDIA
POPULATION GROWTH IN INDIA • Tried to slow population growth for five decades • Most populous country in 2015 • Population Control: Gender bias • Problems increase with growing population • Poverty • Malnutrition • Environmental degradation • Growing middle class – resource consumption
6-5 WHAT ARE THE MAJOR URBAN RESOURCE AND ENVIRONMENTAL PROBLEM URBAN LIVING • Half the world lives in urban areas • 79% of Americans live in cities • 50% of world population lives in cities • Urban areas continue to grow • Natural increase • Immigration • Major Trends in Urban Growth • Proportion of urban global population growing • Number and sizes of urban areas mushrooming • Rapid increase in urban populations in developing countries • Urban growth slower in developed nations • Poverty increasing
CASE STUDY URBANIZATION IN UNITED STATES
URBANIZATION IN UNITED STATES • 1800–2009: urban population increased from 5% to 79% • Migration patterns • Rural areas to large cities • Large cities to suburbs and smaller cities • Cities and suburbs to rural areas • North and East to South and West • Better working and housing conditions compared to the past • Improved environmental conditions • Problems in urban areas • Aging infrastructure • Budget problems
URBAN SPRAWL CAUSES • Prosperity • Ample and affordable land • Automobiles • Cheap gasoline • Poor urban planning
URBAN SPRAWL PROBLEMS • Increased automobile use • Decreased energy efficiency • Destruction of cropland, forests, wetlands • Economic deaths of some cities
1973 2003 Urban sprawl in and around the U.S. city of Las Vegas, Nevada, between 1973 and 2003.
Natural Capital Degradation Urban Sprawl Land and Biodiversity Energy, Air, and Climate Water Economic Effects Loss of cropland Increased use of surface water and groundwater Increased energy use and waste Decline of downtown business districts Loss of forests and grasslands Increased runoff and flooding Increased air pollution Increased unemployment in central city Loss of wetlands Increased greenhouse gas emissions Increased surface water and groundwater pollution Loss and fragmentation of wildlife habitats Can enhance climate change Loss of tax base in central city Decreased natural sewage treatment
ADVANTAGES OF URBANIZATION • Economic development • Innovation • Education and jobs • Technological advances • Longer life spans • Better social and medical services • Recycling more feasible • Biodiversity increased • Increased energy efficiency
DISADVANTAGES OF URBANIZATION • Unsustainable systems • Lack of vegetation • Water problems • Pollution and health problems • Noise pollution • Climate and artificial light • Urban heat islands • Light pollution
Inputs Outputs Energy Solid wastes Waste heat Food Air pollutants Water Water pollutants Raw materials Greenhouse gases Manufactured goods Manufactured goods Noise Money Wealth Information Ideas
CASE STUDY MEXICO CITY
MEXICO CITY • Large population • Severe noise, water, and air pollution • 50% unemployment • 100,000 premature deaths per year • 3 million without sewer • Fecal snow • Geography contributes to air pollution • Progress – tree planting and lower air pollution
6-6 HOW DOES TRANSPORTATION AFFECT URBAN ENVIRONMENTAL IMPACT • Concept 6-6 In some countries, most people live in dispersed urban areas and depend mostly on motor vehicles for their transportation.
Cities Can Grow Outward or Upward • Compact cities • Transportation by walking, biking, or mass transit • Hong Kong, Tokyo • Dispersed cities • Transportation by automobile • Most American cities
Trade-Offs Bicycles Advantages Disadvantages Are quiet and non-polluting Provide little protection in an accident Take few resources to make Provide no protection from bad weather Burn no fossil fuels Are impractical for long trips Require little parking space Secure bike parking not yet widespread
Trade-Offs Mass Transit Rail Advantages Disadvantages Uses less energy and produces less air pollution than cars do Is expensive to build and maintain Is cost-effective only in densely populated areas Reduced need for more roads and parking areas Commits riders to transportation schedules Causes fewer injuries and deaths than cars do Reduces car congestion in cities Can cause noise and vibration for nearby residents
Trade-Offs Rapid Rail Advantages Disadvantages Is much more energy efficient per rider than cars and planes are Is costly to run and maintain Causes noise and vibration for nearby residents Produces less pollution than do cars and planes Can reduce need for more air travel, cars, roads, and parking areas Has some risk of collision at car crossings
Trade-Offs Buses Advantages Disadvantages Can greatly reduce car use and air pollution Can lose money because they require affordable fares Can get caught in traffic and add to noise and pollution Can be rerouted as needed Cost less to develop and maintain than heavy-rail system Commit riders to transportation schedules