Download
1 / 9
90 likes | 101 Vues
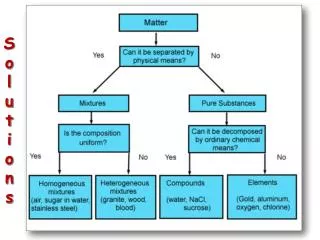
Students learn water discharge measurement by dumping salt upstream to measure electrical conductivity downstream. Utilize KaleidaGraph for plotting and calculations, observe stream characteristics, and compare field techniques. Enhance understanding of conservation of mass.

E N D
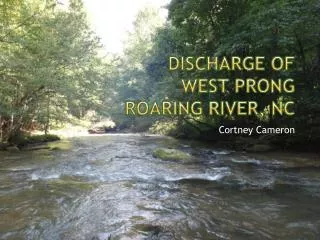
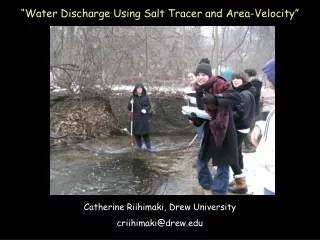
“Water Discharge Using Salt Tracer and Area-Velocity” Catherine Riihimaki, Drew University criihimaki@drew.edu
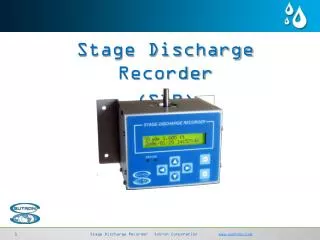
Salt Tracer Discharge Area-Velocity Discharge 1. Dump salt upstream 2. Measure electrical conductivity downstream
Goals of assignment: • Students learn basic plotting in KaleidaGraph • Excel can work too, but K-Graph can integrate curve automatically • We use K-Graph later in course because it has more options for complex curve-fitting • Students learn some calculation tools in K-Graph (or return to visual integration) • Students have opportunity to observe stream characteristics • Students can compare strengths and weaknesses of two field techniques • Students think about conservation of mass
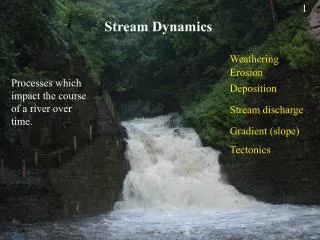
Rearrange… The background Reach of stream of length L and discharge Q Ms: added mass of salt at upstream end C0: background concentration C1: new concentration due to the addition of Ms QC0: background rate of mass transport of salt (in kg/s) QC1: background plus additional mass transport due to the added tracer Over a time of observation T: Incoming mass of salt naturally plus added mass of salt equals the mass leaving the reach
Solve for Q The background Convert concentration to electrical conductivity E using conversion factor F
Procedures: • Introduce conservation of mass • Introduce salt tracer method • Go into field for measurements (1 50-minute class) • Need 1 salt dumper • 2-3 people per measurement team (measurer, timer, recorder) • Record every 10-30 seconds (background through peak back to background) • All or some do area-velocity measurements • Students work independently out of class on calculations • Students complete a lab write-up with graphs
Why this activity: • Many of the students have done area-velocity measurements, but not salt tracer • Wading is not necessary unless area-velocity calculations are done concurrently • Good opportunity for methodology comparison • The students will have some measure of skepticism that the procedure will work until they do the calculations • Portability: • Need electrical conductivity meter(s), bucket, salt • Can use both methods or just replace area-velocity method in your discharge lab • Try it yourself first!