Download
1 / 62
640 likes | 769 Vues
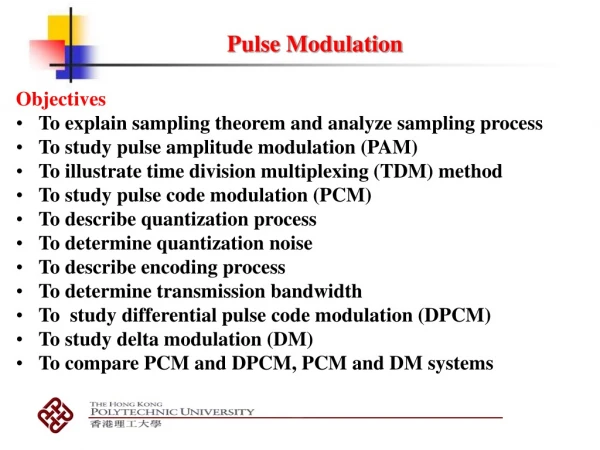
This document provides an in-depth look at Pulse Amplitude Modulation (PAM), a key signalling technique used in communication systems. It discusses the roles of modulators and demodulators, illustrating how discrete amplitude serial symbols (bits) are converted to analogue output pulses for transmission. We cover essential topics such as binary PAM, multilevel PAM, the importance of filtering, data detection methods, and synchronization to handle intersymbol interference (ISI). The aim is to deliver a comprehensive understanding of PAM and its practical applications in modern communications.

E N D
3F4 Pulse Amplitude Modulation (PAM) Dr. I. J. Wassell
Modulator Channel Demodulator Introduction • The purpose of the modulator is to convert discrete amplitude serial symbols (bits in a binary system) ak to analogue output pulses which are sent over the channel. • The demodulator reverses this process ak Serial data symbols ‘analogue’ channel pulses Recovered data symbols
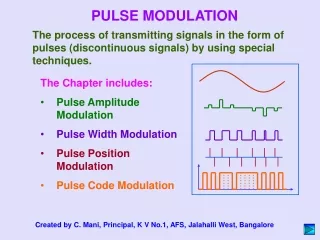
Introduction • Possible approaches include • Pulse width modulation (PWM) • Pulse position modulation (PPM) • Pulse amplitude modulation (PAM) • We will only be considering PAM in these lectures
PAM • PAM is a general signalling technique whereby pulse amplitude is used to convey the message • For example, the PAM pulses could be the sampled amplitude values of an analogue signal • We are interested in digital PAM, where the pulse amplitudes are constrained to chosen from a specific alphabet at the transmitter
Modulator ak Pulse generator Transmit filter HT(w) hT(t) Symbol clock Demodulator Channel Recovered symbols Data slicer Receive filter + Noise N(w) HR(w), hR(t) Recovered clock PAM Scheme HC(w) hC(t)
PAM • In binary PAM, each symbol ak takes only two values, say {A1 and A2} • In a multilevel, i.e., M-ary system, symbols may take M values {A1, A2 ,... AM} • Signalling period, T • Each transmitted pulse is given by Where hT(t) is the time domain pulse shape
PAM • To generate the PAM output signal, we may choose to represent the input to the transmit filter hT(t) as a train of weighted impulse functions • Consequently, the filter output x(t) is a train of pulses, each with the required shape hT(t)
Transmit Filter PAM • Filtering of impulse train in transmit filter
PAM • Clearly not a practical technique so • Use a practical input pulse shape, then filter to realise the desired output pulse shape • Store a sampled pulse shape in a ROM and read out through a D/A converter • The transmitted signal x(t) passes through the channel HC(w) and the receive filter HR(w). • The overall frequency response is H(w) = HT(w) HC(w) HR(w)
PAM • Hence the signal at the receiver filter output is Where h(t) is the inverse Fourier transform of H(w) and v(t) is the noise signal at the receive filter output • Data detection is now performed by the Data Slicer
PAM- Data Detection • Sampling y(t), usually at the optimum instant t=nT+tdwhen the pulse magnitude is the greatest yields Where vn=v(nT+td) is the sampled noise and td is the time delay required for optimum sampling • yn is then compared with threshold(s) to determine the recovered data symbols
TX data ‘1’ ‘0’ ‘0’ ‘1’ ‘0’ TX symbol, ak +A -A -A +A -A T Signal at data slicer input, y(t) 0 td Ideal sample instants at t = nT+td Sample clock Sampled signal, yn= y(nT+td) Data Slicer decision threshold = 0V 0 Detected data ‘1’ ‘0’ ‘0’ ‘1’ ‘0’ PAM- Data Detection
Synchronisation • We need to derive an accurate clock signal at the receiver in order that y(t) may be sampled at the correct instant • Such a signal may be available directly (usually not because of the waste involved in sending a signal with no information content) • Usually, the sample clock has to be derived directly from the received signal.
Synchronisation • The ability to extract a symbol timing clock usually depends upon the presence of transitions or zero crossings in the received signal. • Line coding aims to raise the number of such occurrences to help the extraction process. • Unfortunately, simple line coding schemes often do not give rise to transitions when long runs of constant symbols are received.
Synchronisation • Some line coding schemes give rise to a spectral component at the symbol rate • A BPF or PLL can be used to extract this component directly • Sometimes the received data has to be non-linearly processed eg, squaring, to yield a component of the correct frequency.
Intersymbol Interference • If the system impulse response h(t) extends over more than 1 symbol period, symbols become smeared into adjacent symbol periods • Known as intersymbol interference (ISI) • The signal at the slicer input may be rewritten as • The first term depends only on the current symbol an • The summation is an interference term which depends upon the surrounding symbols
Intersymbol Interference • Example • Response h(t) is Resistor-Capacitor (R-C) first order arrangement- Bit duration is T Modulator input Slicer input Binary ‘1’ Binary ‘1’ 1.0 1.0 amplitude amplitude 0.5 0.5 0 2 4 6 0 2 4 6 Time (bit periods) Time (bit periods) • For this example we will assume that a binary ‘0’ is sent as 0V.
‘1’ ‘1’ ‘0’ ‘0’ ‘1’ ‘0’ ‘0’ ‘1’ 1.0 amplitude 0.5 0 2 4 6 time (bit periods) Intersymbol Interference • The received pulse at the slicer now extends over 4 bit periods giving rise to ISI. • The actual received signal is the superposition of the individual pulses
Intersymbol Interference • For the assumed data the signal at the slicer input is, ‘1’ ‘1’ ‘0’ ‘0’ ‘1’ ‘0’ ‘0’ ‘1’ 1.0 amplitude 0.5 Decision threshold 0 2 4 6 time (bit periods) Note non-zero values at ideal sample instants corresponding with the transmission of binary ‘0’s • Clearly the ease in making decisions is data dependant
Intersymbol Interference • Matlab generated plot showing pulse superposition (accurately) Decision threshold amplitude time (bit periods) Received signal Individual pulses
Intersymbol Interference • Sending a longer data sequence yields the following received waveform at the slicer input Decision threshold (Also showing individual pulses) Decision threshold
Eye Diagrams • Worst case error performance in noise can be obtained by calculating the worst case ISI over all possible combinations of input symbols. • A convenient way of measuring ISI is the eye diagram • Practically, this is done by displaying y(t) on a scope, which is triggered using the symbol clock • The overlaid pulses from all the different symbol periods will lead to a criss-crossed display, with an eye in the middle
Example R-C response Eye Diagram h = eye height h Decision threshold Optimum sample instant
Eye Diagrams • The size of the eye opening, h (eye height) determines the probability of making incorrect decisions • The instant at which the max eye opening occurs gives the sampling time td • The width of the eye indicates the resilience to symbol timing errors • For M-ary transmission, there will be M-1 eyes
Eye Diagrams • The generation of a representative eye assumes the use of random data symbols • For simple channel pulse shapes with binary symbols, the eye diagram may be constructed manually by finding the worst case ‘1’ and worst case ‘0’ and superimposing the two
Nyquist Pulse Shaping • It is possible to eliminate ISI at the sampling instants by ensuring that the received pulses satisfy the Nyquist pulse shaping criterion • We will assume that td=0, so the slicer input is • If the received pulse is such that
Nyquist Pulse Shaping • Then and so ISI is avoided • This condition is only achieved if • That is the pulse spectrum, repeated at intervals of the symbol rate sums to a constant value T for all frequencies
H(f) T f 0 T f -2/T -1/T 0 1/T 2/T Nyquist Pulse Shaping
Why? • Sample h(t) with a train of d pulses at times kT • Consequently the spectrum of hs(t) is • Remember for zero ISI
Why? • Consequently hs(t)=d(t) • The spectrum of d(t)=1, therefore • Substituting f=w/2p gives the Nyquist pulse shaping criterion
T f -2/T -1/T 0 1/T 2/T Nyquist Pulse Shaping • No pulse bandwidth less than 1/2T can satisfy the criterion, eg, Clearly, the repeated spectra do not sum to a constant value
Nyquist Pulse Shaping • The minimum bandwidth pulse spectrum H(f), ie, a rectangular spectral shape, has a sinc pulse response in the time domain, • The sinc pulse shape is very sensitive to errors in the sample timing, owing to its low rate of sidelobe decay
Nyquist Pulse Shaping • Hard to design practical ‘brick-wall’ filters, consequently filters with smooth spectral roll-off are preferred • Pulses may take values for t<0 (ie non-causal). No problem in a practical system because delays can be introduced to enable approximate realisation.
Causal Response Non-causal response T = 1 s Causal response T = 1s Delay, td = 10s
Raised Cosine (RC) Fall-Off Pulse Shaping • Practically important pulse shapes which satisfy the criterion are those with Raised Cosine (RC) roll-off • The pulse spectrum is given by With, 0<b<1/2T
RC Pulse Shaping H(f) • The general RC function is as follows, T 0 f (Hz)
RC Pulse Shaping • The corresponding time domain pulse shape is given by, • Nowb allows a trade-off between bandwidth and the pulse decay rate • Sometimes b is normalised as follows,
RC Pulse Shaping • With b=0 (i.e., x = 0) the spectrum of the filter is rectangular and the time domain response is a sinc pulse, that is, • The time domain pulse has zero crossings at intervals of nT as desired (See plots for x = 0).
RC Pulse Shaping • With b=(1/2T), (i.e., x = 1) the spectrum of the filter is full RC and the time domain response is a pulse with low sidelobe levels, that is, • The time domain pulse has zero crossings at intervals of nT/2, with the exception at T/2 where there is no zero crossing. See plots for x = 1.
RC Pulse Shaping Normalised Spectrum H(f)/T Pulse Shape h(t) x = 0 x = 0.5 x = 1 f *T t/T
RC Pulse Shaping- Example 1 • Pulse shape and received signal, x = 0 (b = 0) • Eye diagram
RC Pulse Shaping- Example 2 • Pulse shape and received signal, x = 1 (b = 1/2T) • Eye diagram
RC Pulse Shaping- Example • The much wider eye opening for x = 1 gives a much greater tolerance to inaccurate sample clock timing • The penalty is the much wider transmitted bandwidth
Probability of Error • In the presence of noise, there will be a finite chance of decision errors at the slicer output • The smaller the eye, the higher the chance that the noise will cause an error. For a binary system a transmitted ‘1’ could be detected as a ‘0’ and vice-versa • In a PAM system, the probability of error is, Pe=Pr{A received symbol is incorrectly detected} • For a binary system, Pe is known as the bit error probability, or the bit error rate (BER)
BER • The received signal at the slicer is Where Viis the received signal voltage and Vi=Vo for a transmitted ‘0’ or Vi=V1 for a transmitted ‘1’ • With zero ISI and an overall unity gain, Vi=an, the current transmitted binary symbol • Suppose the noise is Gaussian, with zero mean and variance
BER Where f(vn) denotes the probability density function (pdf), that is, and
f(vn) 0 vn a b dx BER
Decide ‘1’ if yn VT Decide ‘0’ if yn<VT BER • The slicer detects the received signal using a threshold voltage VT • For a binary system the decision is For equiprobable symbols, the optimum threshold is in the centre of V0 and V1, ie VT=(V0+V1)/2
f(yn|‘0’ sent) f(yn|‘1’ sent) 0 yn V0 VT V1 P(error|‘1’) P(error|‘0’) BER
BER • The probability of error for a binary system can be written as: Pe=Pr(‘0’sent and error occurs)+Pr(‘1’sent and error occurs) • For ‘0’ sent: an error occurs when yn VT • let vn=yn-Vo, so when yn=Vo, vn=0 and when yn=VT, vn=VT-Vo. • So equivalently, we get an error when vn VT-V0