Download
1 / 11
200 likes | 589 Vues
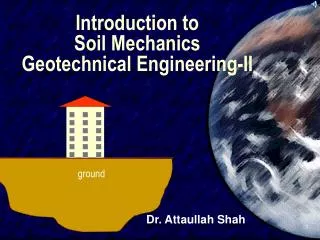
Geotechnical Earthquake Engineering and Measurement of Soil Propertiess. Richard P. Ray, Ph.D., P.E. Civil and Environmental Engineering University of South Carolina. Geology and Seismology of Earthquakes Transmission of Earthquake Energy Study of Near Field Soil-Structure Interaction

E N D
Geotechnical Earthquake Engineering and Measurement of Soil Propertiess Richard P. Ray, Ph.D., P.E. Civil and Environmental Engineering University of South Carolina
Geology and Seismology of Earthquakes Transmission of Earthquake Energy Study of Near Field Soil-Structure Interaction Dynamic Earth Pressures and Slope Stability Liquefaction Topics for Today-Geotech EE
Figure 6—There are a lot of things going on in thisanimation. The 3 grids portray deformation in three zones of a subduction region. Three things to focus onare: 1) The leading edge of the continental plate is lockedwiththe subducting slab, thus gets shortened, building up energy as in the previous animation.Thegraph shows steady change in distance as the land the GPS is mounted to is being forced landward. 2) The center grid is the focus of “Episodic Tremor and Slip” as it is being forced landward by the affects of subduction, but it occasionally backslides, apparently releasing some energy. This backslide is accompanied by earthquake tremors. The small GPS station sitting above the grid reflects the forward-backward motion. (This GPS is the focus of the next animation: 3A.GPS-graph-CU.mov Watch the sawtooth pattern on the graph. (see “What is Episodic Tremor and Slip? next page.) 3) The furthest inland station shows no deformation, thus the graph is flat: no change over time.