Clustering Algorithms
Clustering Algorithms. Minimize distance But to Centers of Groups. Clustering. First need to identify clusters Can be done automatically Often clusters determined by problem Then simple matter to measure distance from new observation to each cluster

Clustering Algorithms
E N D
Presentation Transcript
Clustering Algorithms Minimize distance But to Centers of Groups
Clustering • First need to identify clusters • Can be done automatically • Often clusters determined by problem • Then simple matter to measure distance from new observation to each cluster • Use same measures as with memory-based reasoning
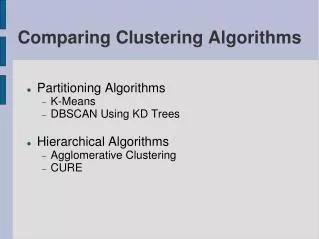
Partitioning • Define new categorical variables • Divide data into fixed number (k) of regions • K-means clustering
Clustering Uses • Segment customers • Find profitability of each, treat accordingly • Star classification: • Red giants, white dwarfs, normal • Brightness & temperature used to classify • U.S. Army • Identify sizes needed for female soldiers • (males – one size fits all)
Tires • Segment customers into product categories • High end (they would buy Michelins) • Intermediate & Low • Standardize data (as in memory-based reasoning)
Standardize • INCOME • MIN(1,INCOME/200000) • AGE OF CAR • IF({AGE OF CAR})<12 months,1, • ELSE[MIN{(8-Years)/7},1]
New Case #1 • From new data (could be test set or new observations to classify) squared distance to each centroid Michelin: 0.840 Goodyear 0.025 Opie’s tires 0.047 • So minimum distance to Goodyear
New Case #2 • Squared distance to each centroid Michelin: 0.634 Goodyear 0.255 Opie’s tires 0.057 • So minimum distance to Opie’s
Software Methods • Hierarchical clustering • Number of clusters unspecified a priori • Two-step a form of hierarchical clustering • K-means clustering • Self-organizing maps • Neural network • Hybrids combine methods
Application: Credit Cards • Credit scoring critical • Use past applicants; develop model to predict payback • Look for indicators providing early warning of trouble
British Credit Card Company • Monthly account status – over 90 thousand customers, one year operations • Outcome variable STATE: cumulative months of missed payments (integer) • Some errors & missing data (eliminated observations) • Biased sample of 10 thousand observations • Required initial STATE of 0
British Credit Card Company • Compared clustering approaches with pattern detection method • Used medians rather than centroids • More stable • Partitioned data • Clustering useful for general profile behavior • Pattern search method sought local clusters • Unable to partition entire data set • Identified a few groups with unusual behavior
Insurance Claim Application • Large data warehouse of financial transactions & claims • Customer retention very important • Recent heavy growth in policies • Decreased profitability • Used clustering to analyze claim patterns • Wanted hidden trends & patterns
Insurance Claim Mining • Undirected knowledge discovery • Cluster analysis to identify risk categories • Data for 1996-1998 • Quarterly data • Claims for prior 12 months • Contribution to profit of each policy • Over 100,000 samples • Heavy growth in young people with expensive automobiles • Transformed data to normalize, remove outliers
Insurance Claim Mining • Number of clusters • Too few – no discrimination – best here was 50 • Used k-means algorithm to minimize least squared error • Identified a few cluster with high claims frequency, unprofitability • Compared 1998 data with 1996 data to find trends • Developed model to predict new policy holder performance • Used for pricing
Computational Constraints • Each cluster should have adequate sample size • Since cluster averages are used, cluster analysis not as sensitive to disproportional cluster sizes relative to matching • The more variables you have, the greater the computational complexity • The curse of dimensionality • (it won’t run in a reasonable time if you have too many variables)