Download
1 / 58
580 likes | 715 Vues
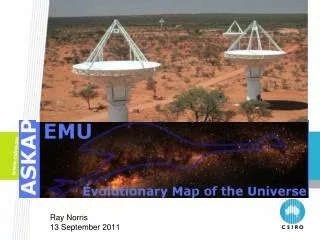
EMU: Evolutionary Map of the Universe. Ray Norris 13 September 2011. Goals of this meeting:. update people on what’s happening get input into future directions tap into local expertise hope to get plenty of round-table discussion as well as presentations

E N D
EMU: Evolutionary Map of the Universe Ray Norris 13 September 2011
Goals of this meeting: • update people on what’s happening • get input into future directions • tap into local expertise • hope to get plenty of round-table discussion as well as presentations if you are not yet part of EMU and you would like to be, please ask me!
ASKAP=Australian SKA Pathfinder • A$170M (=€120m) project now under construction in Western Australia • Completion early 2013 • 36*12m antennas • Antennas have a 92-pixel phased array feed (PAF) • 30 sq. deg FOV!
ASKAP Design Specifications • Number of antennas 36 (630 baselines) • Antenna diameter 12 m (3 axis) • Maximum baseline 6 km • Cont. Angular resolution 10 arcsec • Sensitivity 65 m²/K • Frequency range 700 – 1800 MHz • Focal plane phased array 188 elements (92 dual pol) • Field of view 30 deg² • Processed bandwidth 300 MHz • Number of channels 16 384
Current major 20cm surveys NVSS 75% of sky rms=450μJy EMU 75% of sky rms=10μJy EMU+WODAN 100% of sky Increasing area Increasing sensitivity
Darwin INDIAN OCEAN CORAL SEA NORTHERNTERRITORY QUEENSLAND Alice Springs WESTERNAUSTRALIA Brisbane Murchison RadioAstronomy Observatory SOUTHAUSTRALIA NEW SOUTHWALES Perth Sydney Adelaide ACT Canberra VICTORIA Melbourne SOUTHERN OCEAN TASMANIA Hobart
Darwin INDIAN OCEAN CORAL SEA NORTHERNTERRITORY QUEENSLAND Alice Springs WESTERNAUSTRALIA Brisbane Murchison RadioAstronomy Observatory SOUTHAUSTRALIA NEW SOUTHWALES Perth Sydney Adelaide ACT Canberra VICTORIA Melbourne SOUTHERN OCEAN TASMANIA Hobart Australia – WA – Midwest – Murchison Geraldton
Darwin INDIAN OCEAN CORAL SEA NORTHERNTERRITORY QUEENSLAND Alice Springs WESTERNAUSTRALIA Brisbane Murchison RadioAstronomy Observatory SOUTHAUSTRALIA NEW SOUTHWALES Perth Sydney Adelaide ACT Canberra VICTORIA Melbourne SOUTHERN OCEAN TASMANIA Hobart Murchison gazetted towns: 0 population: “up to 160” Geraldton
Darwin INDIAN OCEAN CORAL SEA NORTHERNTERRITORY QUEENSLAND Alice Springs WESTERNAUSTRALIA Brisbane Murchison RadioAstronomy Observatory SOUTHAUSTRALIA NEW SOUTHWALES Perth Sydney Adelaide ACT Canberra VICTORIA Melbourne SOUTHERN OCEAN TASMANIA Hobart Murchison gazetted towns: 0 population: “up to 160” Geraldton
−50° −10° Configuration and uv-coverage • Antenna configuration • 2-km core with 30 antennas • 6 antennas further out
36 Antenna Array Configuration Natural weighting: resolution 20 arcsec Continuum: uniform weighting: resolution 10 arcsec Spectral Line:Inner 30 dishes only, resolution 30 arcsec (all at 1.4 GHz) Gupta et al. 2008, ATNF ASKAP Memo 21
Sensitivity of EMU to a 1 Mpc cluster halo:
Antennas Antennas built by CETC54 (China) Delivered and assembled on site Antenna 1 delivered late 2009
Antennas Antennas 2-6
Data Transport • Direct burial of 300km fibre (Boolardy-Geraldton) started Oct 2010 • Now complete(June 2011) • Includes 3 repeater huts • NBN network Perth-Geraldtonalso completed June 2011
BETA: Boolardy Engineering Test ArrayBETA construction on schedule
ASKAP current status • Construction is on schedule • 36 antennas in place by end of 2011 • fibre all in place • eVLBI to NZ conducted in July 2011 • Parkes PAF is performing well • BETA will be available end of 2011/early 2012
PAF performance • Performing very well • Tsys < 50K at low freq • Tsys ~ 100K at high freq • can be fixed
ASKAP – Possible schedule • End of 2011: • 36 antennas on site • all hardware on site for 6-antenna BETA array • Early 2012: BETA commissioning starts • 2012-2013 ASKAP Design enhancement • Use experience from Mki PAF to develop MkII PAF • Better PAFs at lower cost • March 2013: Science-ready ASKAP available • minimum of 12 antennas equipped with PAFs • 2013… Antennas continue to be equipped with PAFs as funding permits • A good target would be: • All antennas equipped with upgraded PAFs by Dec 2013
The Science 38 proposals submitted to ASKAP 2 selected as being highest priority 8 others also supported • EMU all-sky continuum(PI Norris) • WALLABY all-sky HI(PI Koribalski & Staveley-Smith) • COAST pulsars etc • CRAFT fast variability • DINGO deep HI • FLASH HI absorption • GASKAP Galactic • POSSUM polarisation • VAST slow variability • VLBI
Deep radio image of 75% of the sky (to declination +30°) • Frequency range: 1100-1400 MHz • 40 x deeper than NVSS • 10 μJy rms across the sky • 5 x better resolution than NVSS (10 arcsec) • Better sensitivity to extended structures than NVSS • Will detect and image ~70 million galaxies at 20cm • All data to be processed in pipeline • Images, catalogues, cross-IDs, to be placed in public domain • Survey starts 2013 • Total integration time: ~1.5 years ?
Complementary radio surveys • Westerbork-WODAN • using Apertif PAF on Westerbork telescope • will achieve similar sensitivity to EMU • will observe northern quarter of sky (δ>+30°) • well-matched to EMU • LOFAR continuum surveys • lower frequency • covering Northern half(?) of sky • valuable because yields spectral index • Meerkat-MIGHTEE • Potentially deeper over smaller area, but will be limited by confusion until Meerkat Phase II (2016?)
ATLAS=Australia Telescope Large Area Survey Slide courtesy of Minnie Mao
The role of ATLAS as a testbed for EMU ATLAS • has the same rms sensitivity (10uJy) as EMU • has the same resolution (10 arcsec) as EMU • covers (only!) 7 sq. deg. • has (2000) 16000 galaxies We’re using ATLAS to test many aspects of EMU • Imaging (dynamic range, weighting) • Source extraction • Cross-identification • Source database and VO server • Science!
How did galaxies form and evolve? Science Goals
Redshift distribution of EMU sources Based on SKADS (Wilman et al.2006)
Science Goals • Evolution of SF from z=2 to the present day, • using a wavelength unbiased by dust or molecular emission. • Evolution of massive black holes • and understand their relationship to star-formation. • Explore the large-scale structure and cosmological parameters of the Universe. • E.g, Independent measurement of dark energy evolution • Explore an uncharted region of observational parameter space • almost certainly finding new classes of object. • Explore Diffuse low-surface-brightness radio objects • Generate an Atlas of the Galactic Plane • Create a legacy for surveys at allwavelengths (Herschel, JWST, ALMA, etc)
Science Goal 1: To trace the evolution of the dominant star-forming galaxies from z=5 to the present day, using a wavelength unbiased by dust or molecular emission.
SFR measurable (5σ) by EMU HyperLIRG z=4 Arp220 z=2 Measured radio SFR does not need any extinction correction M82 z=0.4 Milky Way z=0.1 With 45 million SF galaxies, can stack to measure SFR to much higher z
Redshift 0 1 2 3 4 5 Region occupied by unidentified sub-mJy radio sources? What dominates SFR at each z? (From Hopkins et al 2004, Barger et al 2000) 13.7 6 5 4 3 2 1 Time since Big Bang (Billions of years) Present Day
Science Goal 2: • To trace the evolution of massive black holes throughout the history of the Universe, and understand their relationship to star-formation.
EMU will detect 25 million AGN • We will detect rare objects, such as • high-z AGN • composite AGN/SF galaxies • galaxies in a brief transition phase from quasar-mode to radio-mode accretion. • Norris et al. 2008, arXiv:0804.3998 • S20cm= 9mJy • z= 0.932 • L20cm= 4 x 1025 WHz-1 • Other questions: • How much early activity is obscured from optical views? • Can we use trace the evolution of MBH with z? • When did the first MBH form?
F00183-7111 (ULIRG with L=9.1012 Lo) Merger of two cool spirals: • SB just turned on - AGN just turned on • radio jets already at full luminosity, boring out through the dust/gas • Almost no sign of this at optica/IR wavelengths • see Norris et al. arXiv:1107.3895 1 kpc 20kpc P=6.1025 W/Hz z=0.327
Science Goal 3: To use the distribution of radio sources to explore the large-scale structure and cosmological parameters of the Universe. • Radio surveys are unbiased by dust & sky lines • How similar are the cosmic webs of AGNs and SF galaxies? • Did they have a common origin? • We can use head-tail galaxies as probes of clustering to high z. • We should detect Integrated Sachs-Wolfe (ISW) effect directly, so testing the scale of Dark Energy at z > 1 z=0.22. From Mao et al 2010,MNRAS, in press.
Integrated Sachs-Wolfe Effect From http://ifa.hawaii.edu/cosmowave/supervoids/ ~10°
Science Goal 3: Cosmoology and Fundamental Physics • EMU (70 million galaxies) has fewer objects than DES (300 million) but samples a larger volume • => complementary tests EMU
Dark Energy Current error ellipse Current best value Standard ΛCDM EMU error ellipse See Raccanelli et al. ArXiv 1108.0930 “Current error ellipse” is based on Amanullah et al., 2010, ApJ, 716, 712, plus Planck data
Modified Gravity Current error ellipse Current best value Standard GR EMU error ellipse See Raccanelli et al. ArXiv 1108.0930
Science Goal 4: To explore an uncharted region of observational parameter space, almost certainly finding new classes of object. 6.1 mJy at 20 cm < 5 µJy at 3.6µm • Norris et al 2007, MNRAS, 378, 1434; Middelberg et al 2008, AJ, 135, 1276; Garn & Alexander, 2008, MNRAS,391,1000; Huynh et al.,2010, ApJ, 710, 698; Norris et al. 2011, ApJ, in press
SERVS Warm Spitzer observations of IFRS 3.6 μm Flux density = 0.21 +0.14 μJy. • SERVS=>1400 hours on Spitzer • 3.6 μm median stacked image • Median of 39 images • Flux density = 0.21 +0.14 μJy. • Pixel size = 0.6 arcsec. SERVS=>1400 hours on Spitzer Median of 39 3.6 μm images Norris et al. 2011, ApJ, in press.
SKA pathfinders Limit of conventional radio-telescopes What is the density of new discoveries in parameter space? • ATLAS pushed the boundaries by only a factor of a few, yet discovered two new classes of objects (PRONGS, IFRS). • What happens when we push the boundary by a factor of 40?
New WG: Discovering the Unexpected(WTF: Widefield ouTlier Finder) Instead of hoping to stumble across new types of object, we will systematically mine the EMU database, discarding objects that already fit known classes of object based on their: • morphology • spectral index • polarisation • SED in optical/IR • etc Objects that remain will be either • processing artefacts (important for quality control) • statistical outliers of known classes of object (interesting!) • New classes of object (WTF)
Science goal 6: Produce the most complete catalogue of the Galactic Plane to date. Much deeper and higher res than any other survey: • CGPS: arcmin, few mJy, 73° of Northern plane • SGPS: arcmin, 35 mJy, most of S plane • MAGPIS: 6 arcsec, 1-2 mJy, 27° of N plane • EMU: 10 arcsec, down to 50 μJy, most of plane • all of plane when linked to WODAN • Build a complete census (and possibly discover new types of): • all phases of HII region evolution • the most compact and youngest supernova remnants • radio-emitting Planetary Nebulae to constrain galactic density and formation rate Helfand et al 2006, AJ 131, 2525.
HR diagram for 420 radio stars (Gudel, 2002) Science goal 7: Radio stars Goals • Increase # of known radio stars by 10-100 • Discover new types and define typical populations (unbiased) • Identify trends and correlations • current samples too small • Understand stellar magnetic activity • Understand coherent emission mechanisms Algol: Mutel et al 2009
New EMU leadership structure Ray Norris Project Leader Andrew Hopkins Project Scientist IlanaFeain Project Scientist Nick Seymour Project Scientist Design Study Working Groups Science Working Groups
Design Study Working Groups • Observing Strategy (Shea Brown) • Commissioning, BETA, Observing Process (Ilana Feain) • Simulations (Emil Lenc) • Data processing Pipeline (Tom Franzen) • Compact Source Extraction (Andrew Hopkins) • Extended Source Extraction (Tom Franzen) • Quality Control (Lisa Harvey Smith) • Automated cross-IDs (Loretta Dunne) • Galaxy Zoo Cross-IDs (Julie Banfield) • Data Requirements (Ray Norris) • Data Access and VO (Minh Huynh) • Redshifts (Nick Seymour) • WTF (Ray Norris)