Download
1 / 56
560 likes | 678 Vues
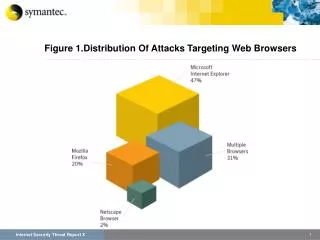
This report provides an in-depth analysis of various cyber threats targeting web browsers, including trends in attack distribution, vulnerability exposure, and phishing activities across sectors. It features critical figures on browser vulnerabilities, denial of service attacks, and the prevalence of bot networks. Furthermore, the study examines the effectiveness of patch development times for operating systems and web browsers, identifying the most frequently exploited vulnerabilities. This document serves as a vital resource for understanding contemporary cyber threats and enhancing security measures.

E N D