Download
1 / 15
150 likes | 254 Vues
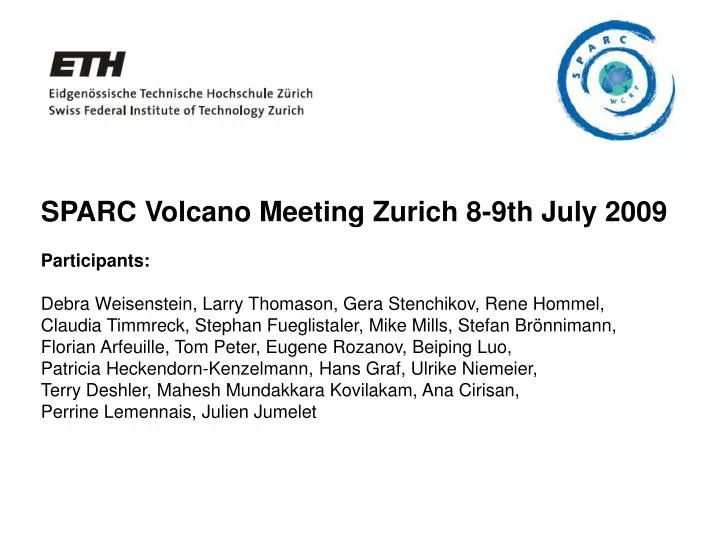
SPARC Volcano Meeting Zurich 8-9th July 2009 Participants: Debra Weisenstein, Larry Thomason, Gera Stenchikov, Rene Hommel, Claudia Timmreck, Stephan Fueglistaler, Mike Mills, Stefan Brönnimann, Florian Arfeuille, Tom Peter, Eugene Rozanov, Beiping Luo,

E N D
SPARC Volcano Meeting Zurich 8-9th July 2009 Participants: Debra Weisenstein, Larry Thomason, Gera Stenchikov, Rene Hommel, Claudia Timmreck, Stephan Fueglistaler, Mike Mills, Stefan Brönnimann, Florian Arfeuille, Tom Peter, Eugene Rozanov, Beiping Luo, Patricia Heckendorn-Kenzelmann, Hans Graf, Ulrike Niemeier, Terry Deshler, Mahesh Mundakkara Kovilakam, Ana Cirisan, Perrine Lemennais, Julien Jumelet
Program Introduction Welcome Tom Peter Uncertainties in modeling volcanic eruptions Patricia Heckendorn Part I: Observation of Mt. Pinatubo eruption in 1991 Issues related to developing a global long-term Larry Thomason stratospheric aerosol climate data set Retrieval of size distribution from SAGE Beiping Luo extinction data Injection height and efficiency Hans Graf Comparison of stratospheric aerosol surface Mahesh Kovilakam densities from SAGE II and OPC measurements Optical particle counter measurements Terry Deshler of stratospheric aerosols Discussion Part I
Program cont Part II: Modeling of stratospheric aerosols formed after volcanic eruptions Sensitivity studies with sulphur model AER Debra Weisenstein of Mt. Pinatubo eruption The aerosol cloud of large volcanic eruptions: Ulrike Niemeier Simulations with MAECHAM5/HAM Sulfate aerosol studies with WACCM/CARMA Mike Mills Stratospheric aerosol modeling: Rene Hommel Scenarios in 3-D and 1-D Discussion Part II
Program cont Part III: Modeling historic/paleo volcanic eruptions Understanding the climate impact of past Claudia Timmreck volcanic eruptions: "Simulations, Observations, Challenges” Modeling past volcanism: Florian Arfeuille The Mt Tambora 1815 eruption case study. Observation-based data and model simulations Stefan Brönnimann of climate effects of major eruptions during the past 125 years” Discussion Part III Part IV: Radiative, chemical and dynamical response to volcanic eruptions Coupled climate model simulations of the Gera Stenchikov Pinatubo and Tambora Impacts. Mt. Pinatubo eruption modeled by CCM SOCOL Eugene Rozanov Volcanoes and their impact on atmospheric Claudia Timmreck chemistry and dynamics
Program cont Do we understand stratospheric temperatures Stephan Fueglistaler in the Pinatubo period? Are the models ready for the volcanic forcing? Hans Graf Effect of geoengineering aerosols on cirrus Ana Cirisan Discussion Part IV & Final Discussion Friday 10th July 2009 Splinter Meetings SAGE-OPC intercomparison in volcanically quiescent periods Geoengineering applications
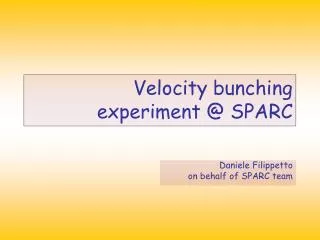
3 2 1 0 -1 -2 T, global annual mean, 50 hPa Anomaly (K) 1980 1990 2000 Sorted according to magnitude of anomaly SOCOL calculated on line using aerosol data from ASAP CMAM calculated on line with climate model radiation scheme E39C precalculated net heating rates Kirchner et al. (1999) UMETRAC precalculated heating rates (Stenchikov, pers. communication, 2005) MAECHAM4C precalculated net heating rates Kirchner et al. (1999) MRI calc. on line from OD and reff based on data by Sato et al. (1993) ERA40 observations, global annual mean, 50 hPa ULAQ calculated on line Pitari (1993) AMTRAC calculated on line with climate model radiation scheme CCSRNIES calculated on line using aerosol data from Sato et al. (1993)
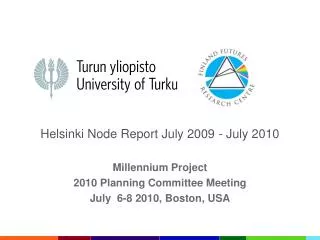
From the ASAP-Report (Assessment of Stratospheric Aerosol Properties) nominal OPC uncertainty uncertainty SAGE extinction uncertainty SAGE SAD assuming n = 20 cm-3 unlimited SAGE uncertainty w/o additional assumption
Low clouds, cirrus and volcanic aerosol above northern midlatitudes, Sept 2009 Very last slide: Zurich, 16 September 2009
Highlight: New Instrument development COBALD Lightweight Backscatter Sonde Feature Specification Remark wavelengths 455 nm & 870 nm color index 1-15 Backscatter 104 from unperturbed dynamic range stratosph. aerosol to thick anvil outflow time resolution 1 s 0.05-3 s selectable dimensions 17 × 14 × 12 cm3 incl. 3 cm insulation total weight 540 g suited for piggyback power supply 8 × LR61 (1.5V AA) for > 3 h of operation 2 × 6LR61 (9V) data interface 19.2 kbit/s, settings for SRS-C34, logic level RS232 adaptable to telemetry altitude range ground to > 30 km cp. weather sondes More on this: Cirisan et al., future work
Part I: Observation of Mt. Pinatubo eruption in 1991 1.1. How much S emitted by Mt. Pinatubo eruption? 4 – 9 – 13 MT S Vertical distribution of the initial SO2cloud? 1.2. What is the vertical distribution of aerosol after gas to particle conversion? 1.3. How good are the extinction measurements of the different instruments? 1.4. Which is the best method to retrieve the aerosol size distribution from extinction measurements? Part II: Modeling of stratospheric aerosols formed after volcanic eruptions 2.1. How good is the performance of different aerosol models? 2.2. Which micro-physical processes are most important for the formation of aerosols after Mt. Pinatubo eruptions? 2.3. Which process dominates at what altitude? To what degree does the answer depend on the type and strength of the volcanic eruption? What does the answer mean of geoengineering applications in comparison to eruptions? Again, what does this mean especially for the tropical tropopause? 2.3. How important is the correct vertical, horizontal and temporal distribution of the aerosol cloud? (HG/MH, DW, CT, KK, LT, MS, PH, ER) In the SPARC stratospheric aerosol report (Thomason and Peter , 2006) the Pinatubo simulation with AER aerosol model injected SO2 in a broad layer (16-29 km altitude, 5°S-14°N). Results from volcanic plume model studies emphasize the importance of the vertical distribution of the sulphur cloud, which is evidently not homogeneous (Herzog & Graf). Would the results of the plume model serving as initial condition for AER 2D model actually lead to an improvement of the aerosol modeling. Part III: Modeling historic/paleo volcanic eruptions 3.1. What information do we have on volcanic eruptions of the last millennium? What are the uncertainties in ice cores volcanic aerosols estimates? (FA, SB, KK/MT, GS) 3.2. How could we model the aerosol distribution of historic eruptions with only a few constraints? (GS, CT, KK/MT, HG/MH, SB/FA) What do we know about spatial and temporal injections of sulphur to the stratosphere? What is the most credible column height for Tambora (Sigurdsson and Carey, 1989: 43km)? What could have been the SO2 vertical distribution of the Tambora cloud? Incidences of the height on aerosol formation. 3.3. For past eruptions as that of Tambora, could a volcanic plume model provide realistic source parameters for the AER 2D model? (HG/MH, DW) 3.4. Did the injection of halogens by past volcanic eruptions have a significant impact on stratospheric ozone and climate? (HG/MH, FA, SB, KK, MT) What are the main mechanisms regulating the percentages of HCl and HBr reaching the stratosphere? The literature ranges from more than 25% reaching the stratosphere (Textor et al 2003) to almost nothing (Tabazadeh&Turco 1993). Would a drastic perturbation of the ozone layer after the Tambora eruption have been documented in terms of significantly increased skin diseases? 3.5. What do we know about aerosol size distributions of very large eruptions? (HG/MH, DW, BL) Is there an upper bound on the mode radius of the aerosol distribution after large volcanic eruptions, as particles with larger radius than such an upper bound are lost due to gravitational settling and washout in the troposphere? Part IV: Radiative, chemical and dynamical response to volcanic eruptions Many CCMs overestimate the lower stratospheric heating after Mt. Pinatubo eruption. If the optical properties are correct (this question should be answered by Sections 1 and 2), there must be a problem either in the radiative transfer code, the cloud scheme or the dynamical response of the model. 4.1. How reliable are the radiative transfer codes of different models? (PH, GS, ER, BL, KK, CT/UN) The heating rates modelled in the lower tropical stratosphere after volcanic eruptions calculated by ECHAM4 and ECHAM5 differ significantly from the ones calculated by Libradtran (pseudospectral model) (Kenzelmann, 2009). Is Libradtran a good reference model? Are there other, better reference models? 4.2. Is there any evidence that the tropical tropopause was heated after volcanic eruptions? (SF, KK) Many modeling studies show a warming of the tropical tropopause. This would presumably lead to a moistening of the stratosphere. Some studies suggest a moistening of the stratosphere (e.g. Oltmans et al., 2000; Joshi and Shine, 2003) some don’t (e.g. ERA interim Randel et al., 2004). 4.3. Which chemical processes lead to the depletion of the ozone layer after volcanic eruptions? (MT, CT, KK, ER, TP, PH) The NOx/NOy and the ClOx/Cly fraction are changed after volcanic eruption with elevated halogen concentrations. Which reactions are responsible for that? Mainly N2O5 hydrolysis or also heterogenous Cl activation? 4.4. How is the stratospheric circulation influenced by volcanic eruptions? (HG/MH/RH, SF, CT/UN, KK, MG, PH, SB)


![Booking Form SPaRC ASM 27 March 2014[1]](https://cdn3.slideserve.com/5485485/slide1-dt.jpg)