Download
1 / 12
400 likes | 1.61k Vues
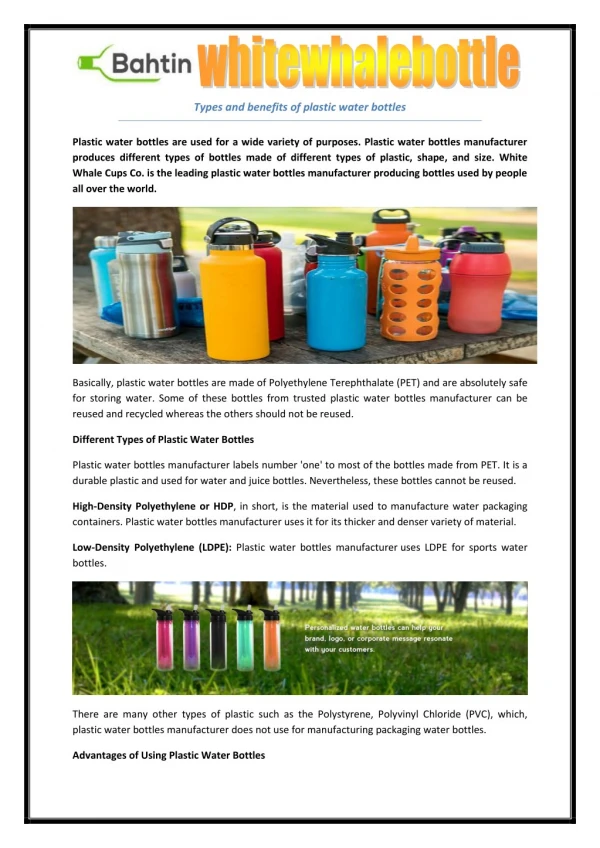
The Life Cycle of Plastic Bottles. Chris Nolan Brent Littlejohn Justin Bernardo Sean Prellar Jr. Research and Product Development. Materials Plastic: Shape of bottle to conserve amount of plastic used Bottles are shaped differently according to desired function and manufacturer

E N D
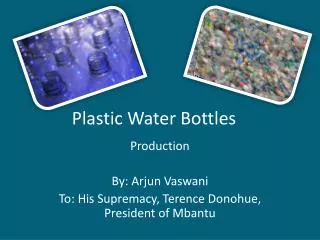
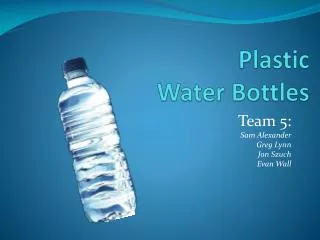
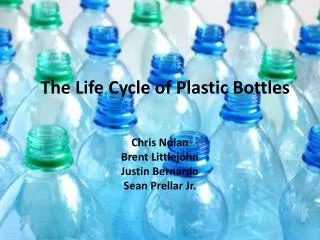
The Life Cycle of Plastic Bottles Chris Nolan Brent Littlejohn Justin Bernardo Sean Prellar Jr.
Research and Product Development Materials Plastic: Shape of bottle to conserve amount of plastic used Bottles are shaped differently according to desired function and manufacturer Labels: Use of recycled paper Source of Water: Spring water Tap water http://www.ehow.com/about_6690934_life-cycle-plastic-bottle.html
Marketing of the Water Bottle • Americans have spent approximately 11 millions dollars on 8.3 billion gallons of water in 2006. • The industries have tried to purvey the water bottle as a fashionable necessity. http://www.filtersfast.com/blog/index.php/tag/sobe-lifewater/ http://articles.sfgate.com/2007-01-17/business/17228941_1_bottled-water-bottled-water-carbonated-soft-drinks
Initial Manufacturing • Bottles are made from a liquid mixture of oil, ethylene, and propylene • Getting these ingredients and shipping them is a whole process in itself, causing pollution
Initial Manufacturing cont. • Made into small pellets which are then made into preforms to be shipped to manufacturing plants • All use virgin plastic, recycled plastic cannot be used for bottles • Preforms are commonly made in china and shipped by boat all around the world
Manufacturing • Blow Molding • Injection: The preform of the bottle is injected with a heated, extruded, metal barrel. • Blowing: Cold air is blown into the mold causing the plastic to expand and take the shape of a bottle. • Ejection: The blow mold opens and the bottle is ejected, then leak tested. http://www.global-plastic-injection-molding.com/plastic-blow-molding.html
Sales, Distribution, and Transportation • There are 1 billion water bottles shipped, trucked, and flown around the world in one week. • That is an equivalent load to 37,800 18-wheeler truck loads. • Water can come from all around the globe including some brands that cost 4 times as much as the equivalent amount of gasoline http://articles.sfgate.com/2007-01-17/business/17228941_1_bottled-water-bottled-water-carbonated-soft-drinks http://www.fastcompany.com/magazine/117/features-message-in-a-bottle.html http://www.sharegreen.ca/?p=1579
Consumer Use • Americans consume 34.6 single-serving plastic water bottles every year • Between 1976 and 1996, U.S. bottled water consumption increased 10-fold from 337 million gallons to 3.2 billion gallons.
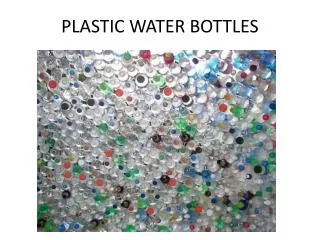
Disposal • Only 15% of PET plastic bottles are recycled • http://www.youtube.com/watch?v=OZbTXDkrD1o&feature=player_embedded • Airport security measures contribute to waste • Disposal is not easy, incineration releases toxic gases and PET is not biodegradable and will sit in landfills for at least 1,000 years • Disposal and cleanup cost taxpayers millions of dollars each year
Recycling Incentives • ‘Bottle Bills’ are bills that require a refundable deposit on recyclable drink containers • The 11 states that have passed these bills have significantly higher recycling rate than the other 39 states, 490 bottles per capita per year compared to 191 bottles per capita per year
Bibliography • http://www.container-recycling.org/issues/bottledwater.htm • http://www.bottlebill.org/ • http://www.usatoday.com/travel/columnist/grossman/2008-09-19-bottled-water_N.htm