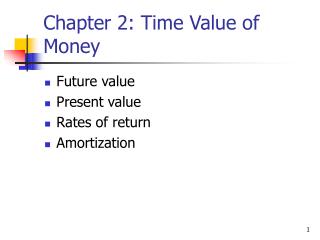
Last Time:
Last Time:. Relationships between Variables Started Simple Least Squares Regression. Relationships among Variables: Interpretations. One variable is used to “explain” another variable. X Variable Independent Variable Explaining Variable Exogenous Variable Predictor Variable. Y Variable

Last Time:
E N D
Presentation Transcript
Last Time: Relationships between Variables Started Simple Least Squares Regression
Relationships among Variables: Interpretations One variable is used to “explain” another variable X Variable Independent Variable Explaining Variable Exogenous Variable Predictor Variable Y Variable Dependent Variable Response Variable Endogenous Variable Criterion Variable
Scatter Plots Y X
The 1970 Vietnam War Draft Lottery http://www.sss.gov/lotter1.htm http://lib.stat.cmu.edu/DASL/Stories/DraftLottery.html
Scatter Plots Y Venus Mars X
Example: Performance in Experiment PRACTICE: Performance Score in a Practice Session TRIAL: Performance Score in a Trial Session Suppose these scores are Interval Scale Case i = Respondent i Sample Size: 10 Respondents
We will end up being reasonably confident that the true regression line is somewhere in the indicated region. Y X
Estimated Regression Line Y errors/residuals X
Estimated Regression Line Y Wrong Picture! Wrong Picture! X Error Terms have to be drawn vertically
Y X
How do we find a and b? In Least-Squares Regression:
In Least-Squares Regression: Computational Formula
Today Least Squares Regression (Simple Linear Regression) Correlation
Can wedo this? Totals:
Slope is 1.09 10.9 10 Intercept is -9
TRIAL = 1.09 PRACTICE - 9 Slope is 1.09 10.9 10 Intercept is -9 You can’t see it in this graph
Look at Residuals & Line Fit Residual Plot Problem: Relationship is not linear Line Fit Plot
Look at Residuals & Line Fit Residual Plot Problem: Predictions are very precise for small predicted values, but very unprecise for large predicted values. (Not good)
Look at Residuals Residual Plot 1 2 3 4 5 6 7 8 9 10 11 12 Problem: Lurking (third) variables (?) Here: Seasonal Trend?
Outliers / Influential Data Points • An outlier is a data point with an exceptionally large residual. • An influential data point is a data point with the property that if you remove that point, then the least squares regression line changes a lot.
Interpretation of linear relationships? Number of babies Number of storks Problem: Lurking (third) variables (?)?
Correlation How strong is the linear relationship between two variables X and Y? Y Slope? Depends on scale units of X and Y X
Correlation Slope in regression of standardized variables How strong is the linear relationship between two variables X and Y? Does not depend on scale units of X and Y
Correlation Slope in regression of standardized variables How strong is the linear relationship between two variables X and Y? This slope tells me How much a given change (in standardized units) of X translates into a change (in standardized units) of Y
Let’s take a closer look… Formula for Regression of Y on X is replaced by the following formula for regression of standardized variables:
Let’s take a closer look… Standardized Variables have Mean Zero Standardized Variables Have Variance One
Let’s take a closer look… Correlation Coefficient
Correlation How strong is the linear relationship between two variables X and Y? Correlation Coefficient Computational Formula:
Properties of Correlation • Symmetric Measure (You can exchange X and Y and get the same value) • -1 ≤ r ≤ 1 • -1 is “perfect” negative correlation • 1 is “perfect” positive correlation • Not dependent on linear transformations of X and Y • Measures linear relationship only
Let’s try it out on our X = PRACTICE, Y = TRIAL Data Set Check this calculation at home!