Coordinated Assessments: Evaluating Indicator Availability and Metrics for Fish Population Management
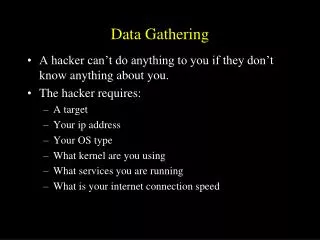
This report outlines a comprehensive approach to assess the availability of three key indicators and supporting metrics crucial for fish population management. Led by Bruce Schmidt from PSMFC and Kathryn Thomas from PNAMP, the study involves deploying temporary data technicians to prioritize populations, gather relevant indicators, and analyze data accessibility challenges. The methodology includes creating a Data Exchange Template (DET) and a Data Analysis Flow Diagram (DAFD). Initial findings highlight progress made, lessons learned, and key gaps identified in the process.

Coordinated Assessments: Evaluating Indicator Availability and Metrics for Fish Population Management
E N D
Presentation Transcript
Coordinated AssessmentsData Gathering Preliminary Results Bruce Schmidt, PSMFC Kathryn Thomas, PNAMP
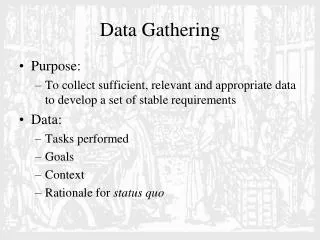
Approach Step 1 Goal: Determine availability of 3 Indicators & supporting metrics Methods: • Deploy temporary Data Technician for each agency • Agency set priorities for starting populations • Obtain Indicators & Metrics • Population scale • Ask: Are the indicators and metrics available? • Data Exchange Template (DET)
Approach Step 1 Goal: Determine availability of 3 Indicators & supporting metrics Methods: • Deploy temporary Data Technician for each agency • Agency set priorities for starting populations • Obtain Indicators & Metrics • Population scale • Ask: Are the indicators and metrics available? • Data Exchange Template (DET) • Data Analysis Flow Diagram (DAFD)
Approach Step 2 Goal: Synthesis of preliminary information Methods: • Identify gaps and needs based on experience and inference: • Data • Data accessibility • Inconsistencies • Hardware • Software • Etc. • Report initial findings
Approach Step 3 Goal: Support development of GNP Methods: • Gather remaining Indicators & Metrics • Track gaps and needs • Assist with GNP report • Assist with data sharing strategy
Preliminary Results • Progress to date • Lessons learned from DET and DAFDs • Availability of Indicators and Metrics • Initial gaps and needs