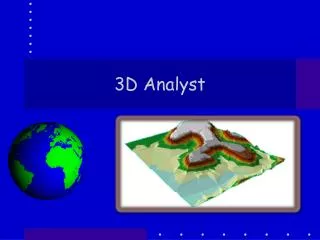
3D Analyst
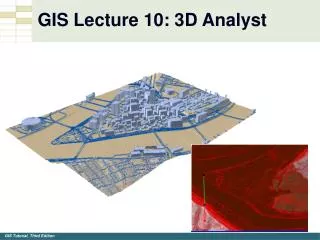
3D Analyst. Basic Idea. What can you do with it? Work in the 3D world so can do Visualization of Viewsheds, lines of sight Steepest path descents (fall lines) Volume and area calculations. Viewshed. visible. Not visible. From Here. Fall line. Steepest path down hill

3D Analyst
E N D
Presentation Transcript
What can you do with it? • Work in the 3D world so can do • Visualization of • Viewsheds, lines of sight • Steepest path descents (fall lines) • Volume and area calculations
Viewshed visible Not visible From Here
Fall line Steepest path down hill In this case over a TIN Triangular Irregular Network
Calculate Volumes and Areas And other stats
The components • ArcScene • ArcGlobe • ArcMap -- this one you know • ArcCatalog – and this one also
ArcScene • Allows visualization of data • Allows 3D interaction with data • Allows Surface Analysis • ArcScene documents are .sxd
ArcGlobe • Data for entire globe – but works for part of globe also • Can Zoom in and view from different downward angles • HUGE databases! • ArcGlobe docs are .33d
3D data • Rasters -- Grids of continuous (usually) surfaces • Elevation • Water Tables • Pollution plumes • TINs • 3D features (buildings, trees, fire hydrants) • These data have Z values
Z • Is an attribute • Can be elevation • But can also be anything else • Depth to water table • Pollutant concentrations • Etc.
Z • Is an attribute • Can be elevation • But can also be anything else • Depth to water table • Pollutant concentrations • Etc.
Raster (Grid) data • Here rainfall decreases from the NW to the SE
Raster (Grid) data • Snow depth as 2D and 3D
TIN • A set of non-overlapping triangles that border one another • Based on point Z data • So are not usually the same size • So you have nodes and edges
Summary • 3D analyst is a powerful tool • Visualization of surfaces with Z values • Analysis of volumes and areas • Viewsheds • Steepest decent • You can put 3D features (buildings, trees, fire hydrants, etc. on the surface