Download
1 / 32
330 likes | 360 Vues
Explore the Waikato Regional Council's river water quality network, variables like major ions, contaminants, and trend analysis from 1993-2012 to comprehend sources of contaminants, conditions, and trends affecting water quality in New Zealand rivers.

E N D
Water quality, 1: Rivers Bill Vant, Waikato Regional Council
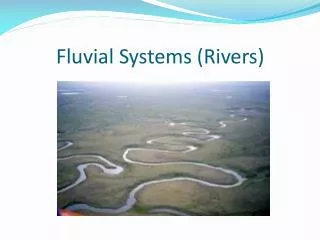
Outline • Variables • Council’s river water quality network • Flow • Changes moving downstream • Sources of contaminants • Condition and trend
Variables: “a huge number” • NZ Drinking Water 2005: standards for 140 contaminants • ANZECC 2000: guidelines for 250 ecological toxicants in water • USEPA (1998) identified “an estimated 87,000” potential endocrine disruptors
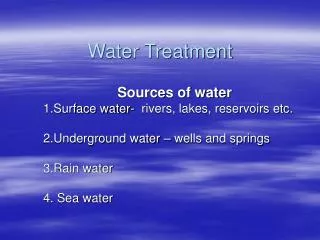
Key types of variables • Major ions: Na, K, Ca, Mg, SO4, Cl, HCO3 • Plant nutrients: various forms of N and P • Inorganic suspensoids, e.g. silt particles • Microbes: viruses, bacteria, protozoans, plankton • Metals (e.g. As, Cd, Cu, Hg, Zn) • Pesticides & other synthetic organics
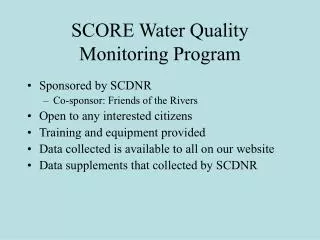
Council’s river water quality network • Waikato River—10 sites, others—100 sites • monthly intervals • >20 variables (“general water quality”) • physical: temperature, conductivity, visibility • chemical: pH, oxygen, nutrients, geothermal • biochemical: BOD, chlorophyll a • microbiological: faecal coliforms, E. coli, enterococci • Waikato—since 1980; others—since 1990
Piako Salinity (March 2012, high tide and low river flow)
Piako Turbidity
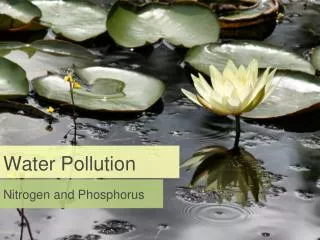
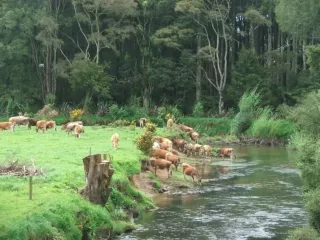
Sources of N and P, 2000-09 (kg/ha/yr) Phosphorus Nitrogen
Trend analysis, using non-parametric statistics • slope (“seasonal Kendall slope estimator”) • = median (Ji - Ji-1, Ji - Ji-2, … , Fi - Fi-1, …) • p-value (“seasonal Kendall trend test”) • = +ve slopes cf. ve slopes
Summary: current condition • excellent in places, poor in others—but not dire • conditions are often “at least satisfactory for desired uses” • differences between zones (e.g. Coromandel cf. Lowland Waikato) • these broadly reflect differing intensity of land use
Summary: trends 1993-2012 • Waikato River: some improvement (ammonia, chlorophyll); some deterioration (turbidity, nitrogen) • Other rivers: some improvement (ammonia), some deterioration (nitrogen) • Pastoral agriculture likely to be the cause of much of the increase in nitrogen