Water Pollution Sources 1. Point Sources
440 likes | 694 Vues
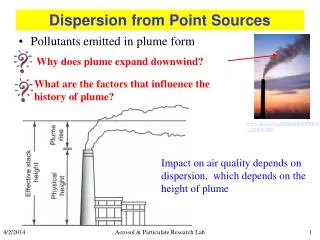
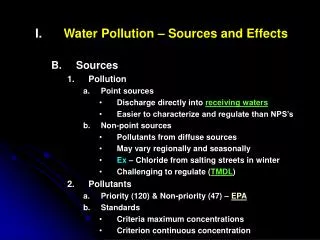
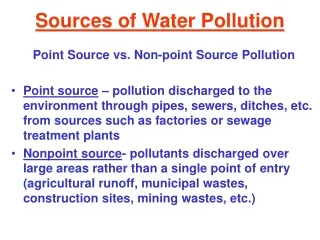
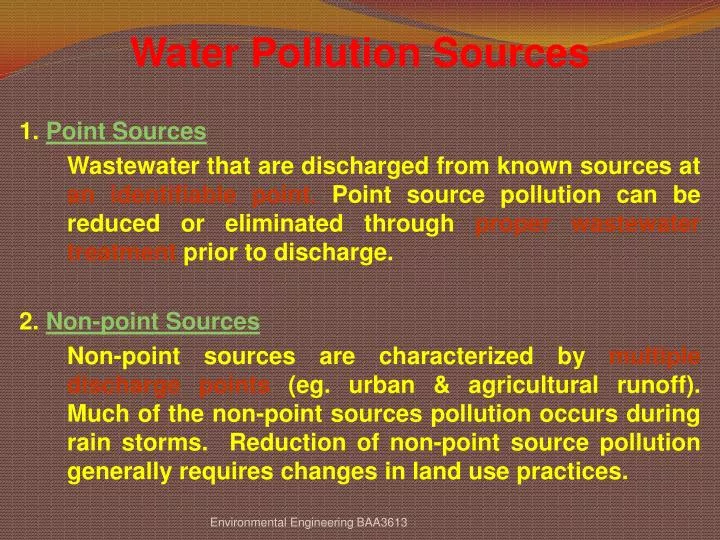
Water Pollution Sources 1. Point Sources Wastewater that are discharged from known sources at an identifiable point. Point source pollution can be reduced or eliminated through proper wastewater treatment prior to discharge. 2. Non-point Sources

Water Pollution Sources 1. Point Sources
E N D
Presentation Transcript
Water Pollution Sources 1. Point Sources Wastewater that are discharged from known sources at an identifiable point. Point source pollution can be reduced or eliminated through proper wastewater treatment prior to discharge. 2. Non-point Sources Non-point sources are characterized by multiple discharge points (eg. urban & agricultural runoff). Much of the non-point sources pollution occurs during rain storms. Reduction of non-point source pollution generally requires changes in land use practices. Environmental Engineering BAA3613
Clean Rivers Environmental Engineering
Data from World Water Commision • 1.4 billion people live without clean drinking water • 7 million people die yearly from disease link to water • Half of world’s rivers and lakes are badly polluted. • 450 million people in 29 countries facing water shortage • By 2025, 2.5 billion people will face water shortage Environmental Engineering
Condition of rivers Environmental Engineering
Effect of River Pollution Environmental Engineering
Polluted Rivers Environmental Engineering
MAP Environmental Engineering
Water Source and Demand • 90% of water supply in Malaysia comes from rivers, streams and reservoirs. • Growing demand of water ( population growth and rapid development) • Per capita availability of water is decreasing due to river pollution Environmental Engineering
WATER QUALITY INDEX Environmental Engineering
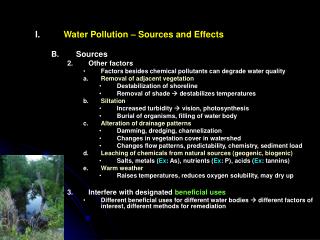
WATER POLLUTION • Associated with water borne diseases. • Sources: • Organic wastes • Inorganic industrial wastes – more difficult • New chemical every year • Heat and dissolved oxygen • Municipal waste • Agricultural Waste • Erosion and sedimentation • Oil and grease (ships, etc.) Environmental Engineering
MALAYSIA • Rich in water resources • Rainfall – 3,000 mm/ yr. • 98 % water use – rivers and streams • Others – groundwater (but 90% - freshwater res.) • Annual average availability - 28,400 m3 per capita. • > 150 rivers in Malaysia • Usage – 5 billion m3 (domestic and industry) • Total – 25 billion m3 (storage) in dams. • Future: National water vision(2025)– Integrated Water Resources Mngt. (IWRM) – policies, various aspects of socio-economic dev. /conservation of the environment. Environmental Engineering
National River Water Monitoring Program • The Dept of Environment (DOE) – started in 1978 • Since 1995 – contracted out to Alam Sekitar Malaysia Sdn.Bhd. (ASMA) (privatization). • 2003 – 926 stations located within 120 river basins in M’sia – monitored. Environmental Engineering
Cases: • 1996: DOE suspended licenses (4 palm oil mills, 4 rubber factories, later revoked – repeated violations). • 23 of 27 rivers in Selangor heavily polluted (sewage, industrial waste, animal waste, heavy metals (1997). • Johor, Penang (also high in industrial water pollution). • October 1997 – 2 treatment plants in Cheras – shutdown (diesel contamination; high ammonia levels). Sources: industrial and quarry activities. • July 2005 – Opening of new Bukit Tagar (near Sungai Selangor ) landfill (8,000 tonnes per day wth. 4,200 m3 leachate per day) may pollute water supply; controversial EIA (July 25,2005). Environmental Engineering
MAIN ISSUES AND CHALLENGES • Institutional and legal issues – inter-agency, National Water Resources Council (NWRC), outdated, redundant, ambiguous laws. • Increased competition for water – urban growth, new dams (env’al costs). • Increased flooding problems – 9% flood prone. • Environmental degradation – water pollution, > 80 tonnes waste/ day (Klang Valley). • Low efficiency of water use – 40-50% efficiency; 1/3 loss before reaching consumer (leaks, illegal connections). • Increased expectations of the people - awareness Environmental Engineering
Common Water Uses • Drinking • Cooking • Washing • Agriculture • Aquaculture • Power generation • Transportation • Recreational • Aesthetic Environmental Engineering
PRECIPITATION/ RAIN (100%) CONDENSATION EVAPORATION (30%) SURFACERUNOFF (20% PERCOLATION (50%) RIVER EVAPOTRANSPIRATION (40%) GROUNDWATERFLOW (10%) Environmental Engineerin HYDROLOGIC CYCLE
Lake Pollution • Differs from river/stream pollution due to physical characteristics of the water mass. • Water in streams/rivers is constantly moving thus providing a flushing action for incoming pollutants. • However, in lakes, the water does not move very much and is retained for a relatively long period of time. • In some cases pollutants discharged into lakes can remain there for many years. • Water quality in lakes is largely influenced by the presence of nutrients. Environmental Engineering
EUTROPHICATION • An increase in the rate of incoming nutrients (nitrogen, phosphorus, carbon) and sediments. • It is a natural aging process (but can be accelerated by human activities) and can be thought of as an inevitable and continual aging process of a lake. Eutrophication stages • Oligotrophic • Mesotrophic • Eutrophic • Senescent Environmental Engineering
Nutrients as Algal Growth Requirements 1. Carbon algae can obtain carbon from CO2 dissolved in the water. The largest source of CO2 is from the atmosphere. 2. Nitrogen usually in the form of nitrate and comes from external sources. 3. Phosphorus phosphorus in lakes originates from external sources and is taken up by algae in the organic form. Environmental Engineering
The process of Eutrophication This is called ….. …..EUTROPHICATION
Eutrophication Stage 1 Deep, clear, cold nutrient-poor water, with very little aquatic life
Oligotrophic Environmental Engineering
Eutrophication Stage 2 Nutrients and sediment begin to accumulate; increasing populations of aquatic life appear
Mesotrophic Environmental Engineering
Eutrophication Stage 3 Nutrient rich, relatively shallow, warmer water, with much plant growth and other aquatic organisms; algal blooms occur
Eutrophic Environmental Engineering
Eutrophication Stage 4 Oldest stage of a lake; very shallow; overgrown with emerging rooted plant life
Senescent Environmental Engineering
BEFORE EUTROPHICATION AFTEREUTROPHICATION Eutrophication will kill all animals and plants in the water
nutrients Wetlands nutrients Lake Environmental Engineering
WETLANDS (Ramsar Convention 1971) Areas of marsh, peatland, or water, whether natural or artificial, permanent or temporary, with water that is static or flowing, fresh brackish or salt, including areas of marine water the depth of which at low tide does not exceed 6 meters (Biological definition) Transition zone between terrestrial and aquatic environments Criteria • The area must be permanently or seasonally inundated • The area must support hydrophytic vegetation • Soil in the area must be water logged for a sufficient time to become anaerobic Environmental Engineering
Man made lakes, reservoirs Man Highland rivers, headwaters Oxbow lakes Lowland rivers Peat swamp forest Mangrove forest Estuaries Mud flats Shallow inshore waters Corals Environmental Engineering
Natural Functions of Wetlands Climatic effects - carbon fixation and CO2 balance (photosynthesis) - rainfall & humidity effects (evaporation & evotranspiration) Biodiversity functions - ecosystem diversity - link between terrestrial and aquatic ecosystem - high species and population diversity - highly diverse microbiological activity Habitat functions - wildlife habitat Environmental Engineering
Natural Functions of Wetlands (cont.) Hydrological & hydraulic functions - storm protection - coastal erosion protection - water holding capacity (water catchment) - water supply Water quality functions - particulate filteration - nutrient stripping - biodegradation of toxic compounds - heavy metal removal - wastewater treatment and water quality improvement Environmental Engineering
Types of Constructed Wetlands 1. Free water surface system (FWS) Environmental Engineering
Types of Constructed Wetlands 2. Subsurface flow system (SFS) Environmental Engineering
Treatment Process in Wetland System 1. Biodegradable organic matter removal Role of wetland vegetation i. providing support medium for microbial degradation ii. conveying oxygen for aerobic degradation to occur 2. Solids removal Settleable solids are removed easily via gravity sedimentation as wetland systems generally have long hydraulic retention time. Filtering of solids by plant stems Environmental Engineering
Treatment Process in Wetland System 3. Nitrogen removal i. nitrification/denitrification ii.uptake by plants 4. Phosphorus removal i. uptake by plants ii.microbial degradation iii.adsorption and precipitation onto soil 5. Heavy metal removal i. precipitation as insoluble metal hydroxides in the aerobic zone of the substratum ii. uptake into roots, rhizomes and leaves of wetland vegetation. Environmental Engineering