Download
1 / 33
340 likes | 474 Vues
Learn how to effectively monitor and control projects using Earned Value Analysis (EVA). Understand key terms like PV, AC, EV, and CR, and use EVA integrations to track cost, schedule, and work progress. Explore variances, indices, and formulas for comprehensive project evaluation.

E N D
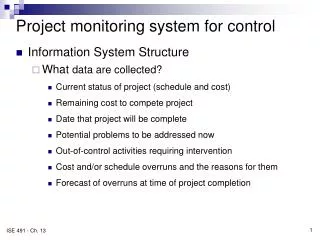
Techniques for monitoring and control • Earned Value Analysis (EVA) • Critical Ratio (CR)
EVA - Some New Terms PV / BCWS – Planned Value: Planned cost of the total amount of work scheduled to be performed by the milestone date. AC / ACWP - Actual Cost: Cost incurred to accomplish the work that has been done to date. EV / BCWP – Earned Value: The planned (not actual) cost to complete the work that has been done.
EVA Integrates All Three It compares the PLANNED amount of work with what has actually been COMPLETED, to determine if COST , SCHEDULE, and WORK ACCOMPLISHED are progressing as planned. Work is “Earned” or credited as it is completed.
Earned Value Analysis • “Earned Value Analysis” is: • an industry standard way to: • measure a project’s progress, • forecast its completion date and final cost, and • provide schedule and budget variances along the way. • By integrating three measurements, it provides consistent, numerical indicators with which you can evaluate and compare projects.
Earned Value Analysis • A way of measuring overall performance (not individual task) by using an aggregate performance measure - Earned Value • Earned value of work performed (value completed) for those tasks in progress found by multiplying the estimated percent physical completion of work for each task by the planned cost for those tasks. The result is amount that should be spent on the task so far. This can be compared with actual amount spent. Chapter10 Project Monitoring & Control
Earned Value Analysis • Refer to earned value chart – basis for evaluating cost and performance to date • If total value of the work accomplished is in balance with the planned (baseline) cost, and actual cost then top mgmt has no particular need for a detailed analysis of individual tasks • Earned value concept – combines cost reporting & aggregate performance reporting into one comprehensive chart Chapter10 Project Monitoring & Control
Earned Value Analysis • Baseline cost to completion – referred to as budget at completion (BAC) • Actual cost to date – referred to as estimated cost at completion (EAC) • Identify several variances according to two guidelines • A negative variance is ‘bad’ • Cost and schedule variances are calculated as earned value minus some other measure Chapter10 Project Monitoring & Control
Earned Value: Example Over Budget Behind Schedule Today Budgeted (Planned) Spending Cost (Person-Hours) Earned Value Actual Spending Time (Date) 9
Earned Value: Example Actual Cost: what you have actually spent to this point in time. Today Budgeted (Planned) Spending Planned Value: what your plan called for sending on the tasks planned to be completed by this date. Cost (Person-Hours) Earned Value Actual Spending Earned Value: value (cost) of what you have accomplished to date, per the base plan. Time (Date) 10
VARIANCES • The cost (or sometimes the spending) variance (CV) is the difference between the amount of money we budgeted for the work that has been performed to date, that is, the earned value, EV, and the actual cost of that work (AC). • The schedule variance (SV) is the difference between the EV and the cost of the work we scheduled to be performed to date, or the planned value (PV). • The time variance (TV) is the difference in the time scheduled for the work that has been performed (ST) and the actual time used to perform it (AT).* In compact form, • EV - AC = cost variance (CV, overrun is negative) • EV- PV = schedule variance (SV, behind is negative) • ST- AT = time variance (TV, delay is negative)
Earned Value Analysis - Variances • Types of variances; • Cost (spending) variance (CV) – difference between budgeted cost of work performed (earned value) (BCWP) and actual cost of that work (ACWP) • Schedule variance (SV) – difference between earned value (BCWP) and cost of work we scheduled to perform to date (BCWS) • Time variance (TV) –difference between time scheduled for work performed (STWP) and actual time to perform it (ATWP) Chapter10 Project Monitoring & Control
Earned Value Variance - Formula Variances CV = BCWP – ACWP (negative value - cost overrun) SV = BCWP – BCWS (negative value - behind schedule) TV = STWP – ATWP (negative value - delay) Index (Ratios) Cost Performance Index (CPI) = BCWP/ACWP Schedule Performance Index (SPI) = BCWP/BCWS Time Performance Index (TPI) = STWP/ATWP Percent Complete = BCWP/BAC
Earned Value Chart – basis for evaluating cost & performance to date Chapter10 Project Monitoring & Control
EXAMPLE Assume that operations on a Work Package cost Rs. 1,500 million to complete. They were originally scheduled to finish today. At this point, we actually spent Rs. 1,350 million. And we estimate that we have completed two thirds (2/3) of the work. Calculate CV, SV,CPI and SPI. Chapter10 Project Monitoring & Control
EXAMPLE Assume that operations on a Work Package cost Rs. 1,500 million to complete. They were originally scheduled to finish today. At this point, we actually spent Rs. 1,350 million. And we estimate that we have completed two thirds (2/3) of the work. Calculate CV, SV,CPI and SPI. CV = BCWP – ACWP = 1500 (2/3) – 1350 = - 350 SV = BCWP – BCWS = 1500 (2/3) – 1500 = - 500 CPI = BCWP/ACWP = 1500(2/3)/1350 = 0.74 SPI = BCWP/BCWS = 1500(2/3)/1500 = 0.67 Spending higher than budget, and given what we have spent, we are not as far along as we should be (have not completed as much work as we should have) Chapter10 Project Monitoring & Control
Possible to have one of indicators to be favorable while the other unfavorable • Might be ahead of schedule and behind costs • Six possibilities (see figure next slide) Chapter10 Project Monitoring & Control
6 Possibilities Earned Value Analysis Chapter10 Project Monitoring & Control
Rough Guides to ‘percent completion’ Calculations Methods for estimating percent completion The 50-50 estimate. 50% is assumed when task is begun, and remaining 50% when work completed. 0-100% rule. This rule allows no credit for work until task is complete, highly conservative rule, project always seem late until the very end of project when everything appears to suddenly catch up
What’s More Important? Knowing where you are on schedule? Knowing where you are on budget? Knowing where you are on work accomplished?
Forecasting Costs • Project manager reviewing what is complete and what remains • Final cost and final completion date are moving targets • The project manager compiles these into a ‘estimate to complete (ETC)’ forecast • Estimate at Completion (EAC) calculation can forecast true project costs based on project performance
Forecasting costs and schedule Actual + forecast = final date and cost at completion EAC = BAC / CPI EAC = ETC + ACWP ETC = BAC / CPI - ACWP ETC = (BAC – BCWP) / CPI Schedule at Completion (SAC) = Original Schedule / SPI
Classroom Practice - 1 Example: Lemonade • Make 1,000 cups over 50 days • Steady rate of 20 cups per day • Budgeted cost per cup is $0.50 • Total project budget is $500 Lemonade Progress • At end of day 10: • 150 cups have been made • Total actual cost is $90. Find the cost and schedule variances and CPI & SPI.
Lemonade Status • BCWS = $100 (Planned Value) • 10 days x 20 cups per day x .50/cup budget • BCWP = $75 (Earned Value) • 150 cups x .50/cup budget • SV = BCWP - BCWS = -$25 • SPI = BCWP / BCWS = 0.75 • CV = BCWP - ACWP = $75 - $90 = -$15 • CPI = BCWP / ACWP = 0.833
Lemonade Forecast • EAC = BAC / CPI = $500 / 0.833 = $600 • VAC = BAC - EAC = $500 - $600 = -$100 (unfavorable) • Schedule at Completion =50 / SPI = 50 / 0.75 = 66.67 days
Classroom Practice - 2 All figures are cumulative 1. What is the CPI at the end of month 4 2. What is the SPI at the end of month 4 3. What is the EAC at the end of month 4 4. What is the ETC at the end of month 4
Critical Ratio • It is possible for one of the indicators to be favorable while the other is unfavorable. • Cost-Schedule Index CSI < 1, it is indicative of problem
Critical ratio • Sometimes, especially large projects, it may be worthwhile calculating a set of critical ratios for all project activities • The critical ratio is actual progress x budgeted cost scheduled progress actual cost • If ratio is 1 everything is probably on target • The further away form 1 the ratio is, the more we may need to investigate Chapter10 Project Monitoring & Control
Summary • Need proper project monitoring and control mechanisms • Tools available to help in monitoring and controlling activities • There are human control and management aspects not covered here Chapter10 Project Monitoring & Control
Quiz The EV measurement of work you planned to have accomplished at a given point in time : BCWP ACSP BCWS ACWS True or False: At any point in time, the CPI tells you exactly how far ahead or behind schedule you are on your project. TRUE FALSE 33
Quiz If BCWP is 20 and ACWP is 15, CPI: .75 1.33 1.0 0 If BCWP is 27, BCWS is 25, you are probably: On schedule Ahead of schedule Behind schedule None of the above 34
Classroom Practice - 3 A project to develop a country park has an actual cost in month 17 of $350,000, a planned cost of $475,000, and a value completed of $300,000. Find the cost and schedule variances and CPI & SPI. BCWS $ Planned (Baseline) – 475,000 ACWP Actual cost – 350,000 Value completed – 300,000 BCWP Time t Month 17 Chapter10 Project Monitoring & Control
Solution BCWS = 475,000 BCWP = 300,000 ACWP = 350,000 CV = 300,000 – 350,000 = -50,000 (negative value - cost overrun) SV = 300,000 – 475,000 = -175,000 (negative value - behind schedule) Cost Performance Index (CPI) = BCWP/ACWP = 300/350 = 0.86 Schedule Performance Index (SPI) = BCWP/BCWS = 300/475 = 0.63 CV = BCWP – ACWP SV = BCWP – BCWS Chapter10 Project Monitoring & Control