Download
1 / 10
100 likes | 121 Vues
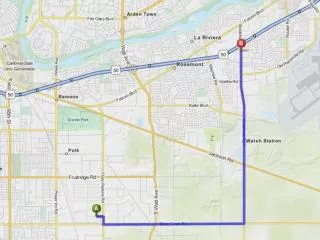
The project includes the demolition of housing units to build a new parking deck with 735 spaces, including 550 replacement spaces and 185 additional spaces. It opens on July 24 with A and B zone permits for summer and D zone permits for fall. Safety and efficiency are prioritized with no space hunting allowed. The comprehensive parking study includes data on space-to-permit ratios and traffic assessment. Occupancy rates are provided by zone, with a total of 2,288 vacant spaces available.

E N D
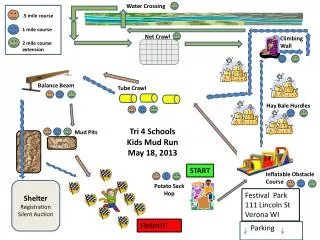
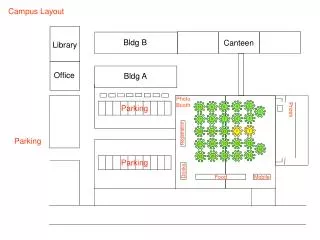
No-cost Commuter Parking Zones • CDV Village • Demolition of housing units • Parking remains • Intramural Fields • JCS Museum
new Parking Deck • 735 Parking Spaces • 550 replacement spaces • 185 additional space • Open: July 24 • Summer: A and B zone Permits • Fall: D zone Permits only • Haley A & B Lots • will close for Student Center construction • Client area of A Lot to remain open
Parking Deck: D Zone Permits • Number of Permits = number of Spaces • Safety / efficiency – no space hunting • D Permits authorized to park in C zones • D Permits not authorized to park in A & B zones • loading / unloading – Loading Zone Permits • anticipate under subscription • First request for Permits – all authorized • if undersubscribed, available to GTAs
Auburn University Statistics • Total spaces – 10,610 • Total vacant spaces – 2,288 • Cost - surface parking space - $2,500 • Cost – garage parking space - $12,500
Comprehensive Parking Study • Open Forum Meetings • early Fall Semester • Data • Space to Permit ratios • Occupancy / Vacancy assessment • Traffic / loading-unloading / congestion • A, B, C, R zones v. geographic zones • SREB Parking Fee Comparison • Residential Parking Strategy
Spaces Available at Peak (empty) By Zone Total: 2,288 A 86 E 47 I 508 B 39 M 386 F 49 C 116 G 76 L 45 J 107 D 208 K 343 H 60 N 218
% Occupancy by Zone Overall Occupancy = 79% A 75% E 89% I 77% M 67% B 95% F 79% C 83% G 65% L 88% J 89% D 85% K 27% H 93% N 60%