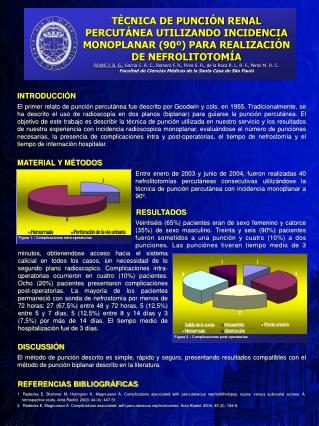
Resultados
SISTEMA DE CUENTAS NACIONALES. Resultados. PRACEM. VALOR AGREGADO BRUTO POR ACTIVIDAD ECONÓMICA AÑO 1997. Millardos de Bs. ESTRUCTURA %. DIVULGADO. PRACEM. DIVULGADO. PRACEM. Agricultura. 1.786. 1.886. 4,1. 4,5. Petroleo Crudo, Gas Natural. 8.755. 7.863. 20,2. 18,7.

Resultados
E N D
Presentation Transcript
SISTEMA DE CUENTAS NACIONALES Resultados PRACEM
VALOR AGREGADO BRUTO POR ACTIVIDAD ECONÓMICA AÑO 1997 Millardos de Bs. ESTRUCTURA % DIVULGADO PRACEM DIVULGADO PRACEM Agricultura 1.786 1.886 4,1 4,5 Petroleo Crudo, Gas Natural 8.755 7.863 20,2 18,7 y Refinación Minería 358 294 0,8 0,7 Manufactura 5.153 7.409 11,9 17,7 Electricidad y Agua 653 859 1,5 2,0 Construcción 2.426 2.988 5,6 7,1 Comercio 5.083 3.105 11,7 7,4 Servicios de Reparaciones 1.767 402 4,1 1,0 Restaurantes y Hoteles 1.614 445 3,7 1,1 Transporte y 2.574 1.556 5,9 3,7 Almacenamiento Comunicaciones 1.142 964 2,6 2,3 Instituciones Financieras y 1.073 1.003 2,5 2,4 Seguros Bienes Inmuebles y Servicios 4.505 4.187 10,4 10,0 Prestados a las Empresas Servicios Comunales, Sociales y Personales, 1.825 1.440 4,2 3,4 excepto reparaciones Productores de Servicios 2.076 4.506 4,8 10,7 del Gobierno General IPSFL que sirven a los 379 269 0,9 0,6 hogares Servicios Domésticos 119 171 0,3 0,4 Sub Totales 41.289 39.348 95,3 93,8 Menos: Serv. Bancarios (1.076) (1.098) (2,5) (2,6) Imputados Más: Impuestos sobre los 3.131 3.932 7,2 9,4 Productos Menos: Subvenc. sobre los 0 (239) 0,0 (0,6) Productos TOTALES 43.344 41.943 100,0 100,0 PRACEM
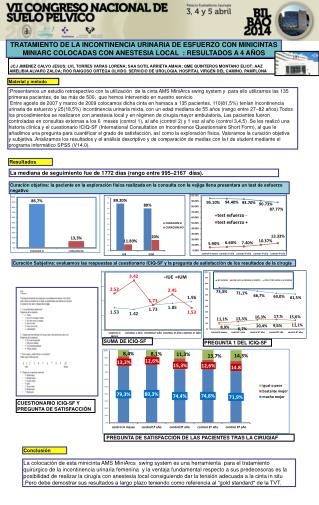
PRODUCTO INTERNO BRUTO Estructura Porcentual Año 1997 100% IP - SIFMI 7,2 IP - SIFMI 8,8 80% No No PRACEM Petrolero Petrolero 60% 72,6 72,4 40% 20% Petrolero Petrolero 20,2 18,7 0% DIVULGADO PRACEM Nota: IP - SIFMI = Impuesto sobre los Productos y las Importaciones menos Subsidios a los Productos menos Servicios de Intermediación Financiera medidos Indirectamente
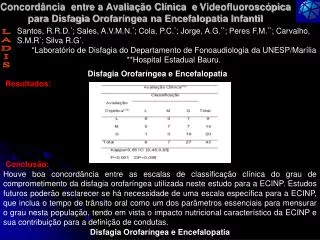
PRODUCTO INTERNO BRUTO Estructura Porcentual Año 1997 100% Petrolero Petrolero 90% 18,7 20,2 80% IP - SIFMI 7,2 8,8 IP - SIFMI PRACEM 70% 60% Servicios Servicios no no 50% Petroleros Petroleros 40% 47,6 54,3 30% 20% Bienes no Bienes no Petroleros 10% Petroleros 24,9 18,3 0% DIVULGADO PRACEM Nota: IP - SIFMI = Impuestos sobre los Productos y las Importaciones menos Subsidios a los Productos menos Servicios de Intermediación Financiera medidos Indirectamente.
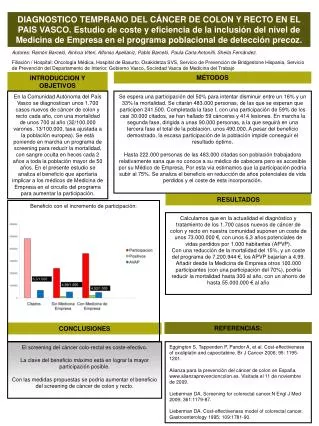
PRODUCTO INTERNO BRUTO Estructura Porcentual Año 1997 100% IP - SIFMI 7,2 IP - SIFMI 8,8 80% Privado Privado PRACEM 58,8 64,7 60% 40% Público 20% Público 32,4 28,1 0% DIVULGADO PRACEM Nota: IP - SIFMI = Impuestos sobre los Productos y las Importaciones menos Subsidios a los Productos menos Servicios de Intermediación Financiera medidos Indirectamente.
APORTE AL PIB DE LAS EMPRESAS NO CONSTITUIDAS EN SOCIEDAD AÑO 1997 Aporte PIB No Aporte PIB Total Petrolero % % PIB 100,0 PRACEM VAB NO PETROLERO 100,0 VAB NO SOCIEDADES 19,9 14,9 Manufactura 2,3 1,7 Comercio 4,2 3,2 Transporte 2,9 2,1 Resto 10,5 7,9
DEMANDA AGREGADA Estructura Porcentual Año 1997 100% 90% 24,0 23,3 Exportaciones 80% 1,9 1,8 PRACEM 70% 15,4 20,9 Variación de 60% Existencias 50% Formación Bruta de Capital Fijo 1/ 40% 54,1 42,3 Consumo Final 30% Privado 20% Consumo Final 10% Público 11,1 5,3 0% DIVULGADO PRACEM 1/ Incluye Adquisición menos Disposición de Objetos Valiosos.
CONSUMO FINAL DE LOS HOGARES Estructura Porcentual Año 1997 100% 2,6 0,1 90% 37,3 80% 39,3 PRACEM 70% Compras Netas 60% de Res. y No Residentes 1/ 50% Servicios 40% 62,6 30% 58,1 Bienes 20% 10% 0% DIVULGADO PRACEM 1/ Compras de Residentes fuera del país menos Compras de No Residentes en el País
PRODUCTO INTERNO BRUTO ENFOQUE DEL INGRESO Estructura Porcentual Año 1997 100% Excedente de 90% Explotación 39,7 80% Ingreso Mixto PRACEM 54,6 70% Derechos de 60% Importación 11,7 50% 1,5 1,7 Impuestos menos 8,3 7,5 Subvenciones 40% 5,5 6,8 30% Consumo de Capital Fijo 20% 33,3 29,4 Remuneraciones 10% 0% DIVULGADO PRACEM
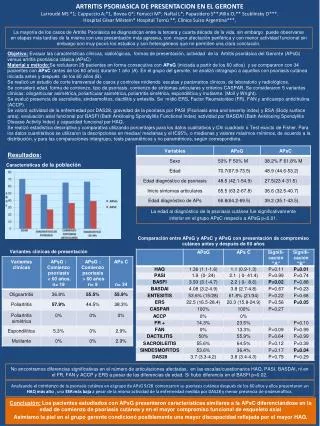
INGRESO NACIONAL DISPONIBLE Millardos de Bolívares Año 1997 39.148 38.535 -1,6 % 40.000 31.332 35.000 27.286 -12,9 % PRACEM 30.000 25.000 20.000 11.249 15.000 7.816 43,9 % 10.000 5.000 0 DIVULGADO PRACEM INGRESO NACIONAL DISPONIBLE GASTOS DE CONSUMO FINAL AHORRO NETO
APLICACIÓN DEL AHORRO BRUTO Millardos de Bolívares Año 1997 13.563 14.000 11.607 26,0 % 12.000 10.763 27,3 % 9.121 PRACEM 10.000 8.000 6.000 4.000 1.956 1.642 19,1 % 2.000 0 DIVULGADO PRACEM AHORRO BRUTO ACUMULACIÓN DE CAPITAL PRESTAMO NETO
PRODUCTO INTERNO BRUTO A Precios Constantes Variaciones Porcentuales 6,0 3,7 4,0 3,4 2,8 3,2 PRACEM 2,0 0,3 0,2 - Porcentajes 1998/1997 1999/1998 2000/1999 2001/2000 (2,0) (4,0) (6,0) (6,0) (6,1) (8,0) DIVULGADO (1984 = 100) PRACEM (1997 = 100)
VALOR AGREGADO BRUTO DE LAS ACTIVIDADES NO PETROLERAS A Precios Constantes Variación Porcentual 6,0 4,2 4,0 4,0 3,0 4,0 PRACEM 2,0 -0,1 0,0 Porcentajes 1998/1997 1999/1998 2000/1999 2001/2000 -0,9 -2,0 -4,0 -5,4 -6,0 -6,9 -8,0 DIVULGADO (1984 = 100) PRACEM (1997 = 100)
VALOR AGREGADO BRUTO DE LAS ACTIVIDADES PRODUCTORAS DE BIENES A Precios Constantes Variación Porcentual 6,0 4,1 4,0 3,3 PRACEM 2,0 1,6 0,8 -0,2 0,0 Porcentajes 1998/1997 1999/1998 2000/1999 2001/2000 -0,6 -2,0 -4,0 -5,7 -6,0 -7,2 -8,0 DIVULGADO (1984 = 100) PRACEM (1997 = 100)
VALOR AGREGADO BRUTO DE LAS ACTIVIDADES PRODUCTORAS DE SERVICIOS A Precios Constantes Variación Porcentual 6,0 4,5 3,5 4,0 4,3 2,7 PRACEM 2,0 0,5 0,1 0,0 Porcentajes 1998/1997 1999/1998 2000/1999 2001/2000 -2,0 -4,0 -4,7 -6,0 -6,7 -8,0 DIVULGADO (1984 = 100) PRACEM (1997 = 100)
VALOR AGREGADO BRUTO DE LAS ACTIVIDADES DEL SECTOR PÚBLICO A Precios Constantes Variación Porcentual 4,0 3,1 2,0 1,3 PRACEM 0,0 -0,7 1998/1997 1999/1998 2000/1999 2001/2000 -1,4 -1,1 -1,7 Porcentajes -2,0 -4,5 -4,0 -6,0 -6,2 -8,0 DIVULGADO (1984 = 100) PRACEM (1997 = 100)
VALOR AGREGADO BRUTO DE LAS ACTIVIDADES DEL SECTOR PRIVADO A Precios Constantes Variación Porcentual 8,0 6,0 5,5 4,5 5,2 4,0 PRACEM 4,0 2,0 1,3 1,2 Porcentajes 0,0 1998/1997 1999/1998 2000/1999 2001/2000 -2,0 -4,0 -6,0 -6,0 -6,7 -8,0 DIVULGADO (1984 = 100) PRACEM (1997 = 100)