Exploitation of GIOVE in-Orbit Radiation Data for Environment Model and Effects Tools Update
660 likes | 827 Vues
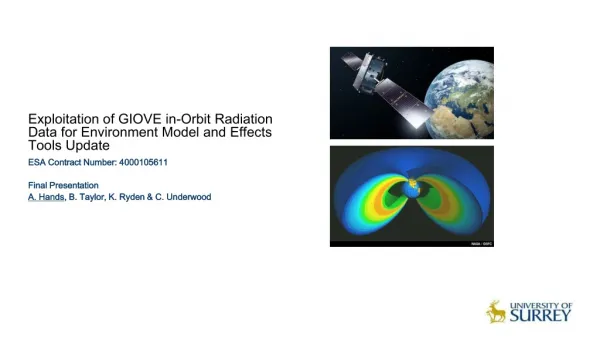
Exploitation of GIOVE in-Orbit Radiation Data for Environment Model and Effects Tools Update. ESA Contract Number: 4000105611 Final Presentation A. Hands , B. Taylor, K. Ryden & C. Underwood. Background.

Exploitation of GIOVE in-Orbit Radiation Data for Environment Model and Effects Tools Update
E N D
Presentation Transcript
Exploitation of GIOVE in-Orbit Radiation Data for Environment Model and Effects Tools Update ESA Contract Number: 4000105611 Final Presentation A. Hands, B. Taylor, K. Ryden & C. Underwood
Background • The Galileo constellation will operate in an intense radiation environment (Medium Earth Orbit) • The outer Van Allen electron belt poses significant radiation risks due to internal charging and ionising dose • Other threats exist from Solar Particle Events • Existing models for worst case environment definition are out-of-date • New data provide an opportunity to re-examine Galileo’s radiation environment specification • Galileo In-Orbit Validation Element (GIOVE) spacecraft equipped with monitors to address these issues
Giove Spacecraft • Technology Demonstrator Satellites for Galileo Constellation • Each Carries Space Environment Monitor(s) • Medium Earth Orbit (~23,500 km, 56°) • Giove-A: • Launched Dec 2005 • Two instruments: • Merlin • Cedex • Giove-B: • Launched Apr 2008 • One instrument: • SREM
Proposal Objectives • To create a calibrated, background-subtracted, clean, electron flux dataset derived from Cedexand Merlin and make comparisons with equivalent SREM data. • To cross-calibrate the proton and ion LET spectra from Cedex, Merlin and SREM. • To validate existing radiation belt models against the data from Giove-A and –B sensors and assess their accuracy. • To assess the Galileo FOC satellite radiation specification against the new data and recent models. • To create a new internal charging-oriented radiation belt model as an update to the existing FLUMIC model. • To exploit the single event upset (SEU), dose, dose-rate and charging current information from Giove instruments and model these effects.
Project Plan Project Overview • Duration (initially) 18 months • Led by QinetiQ, Surrey Space Centre subcontractor • Various staffing changes led to SSC taking over full project • Split into five work packages: Novation to SSC
Task 1: Electron calibration and data processing • Data coverage periods: • Cedex & Merlin (Giove-A): December 2005 – July 2012 • SREM (Giove-B): April 2008 – July 2012 • Electron-detecting Instruments: • Cedex • Photodiodes: • Sensitive to dose-rate • Four diodes with different shielding levels • Merlin • SURF monitor: • Current collecting plates (direct measure of internal charging) • Electrons only • SREM • Silicon Detectors: • Telescopic arrangement • Deconvolution algorithm to separate electrons and protons
Merlin-SURF • Three stacked aluminium charge-collecting plates • Direct measure of energetic electrons • No proton contamination or dead-time • Targeted at internal charging concerns SURF
SURF Data First 6 months: First Day: Recurrence of coronal hole Samples peak of belt every ~7 hours
SURF Instrument Response Functions • Response functions determined by Monte Carlo simulations • Electrons from <1 MeV to ~10 MeV detected by SURF • Lower plate has strong response due to increased thickness • ‘Free’ from proton contamination (v. small opposite polarity currents during SPE) Emin ~ 0.5 MeV
Proton Contamination • No increases in SURF currents during 2012 SPEs • For completeness, proton response functions also calculated • Predicted +ve currents (fA/cm2) during major SPE: cf. electron (-ve) currents (pA/cm2) I.e. even worst case SPE +ve currents << | -ve currents | → No proton contamination (very few SPE during project period in any case)
Electron Flux Determination • Need flux, not current, for inter-instrument comparison and model development • Simple iterative algorithm developed: Adjust folding energy / spectral index and amplitude Exponential or Power-law spectrum Convolve with SURF plate response functions Best fit algorithm Observed currents For more detail see Ryden et al. (2008) IEEE TRANSACTIONS ON PLASMA SCIENCE, VOL. 36, NO. 5, OCTOBER 2008
Example of Electron flux (assuming exponential spectrum) NB Flux most reliable in range: 0.5 – 3 MeV Measure of spectral shape (‘hardness’)
Cedex • Geant4 modelling of dose-rate diode response functions • Forward and reverse Monte Carlo techniques used
Cedex off-set correction • Dose-rate diodes experience variable noise outside radiation belt: Used to clean Cedex data
Electron spectra determination • Ratio between dose-rate diodes used to derive exponential electron flux spectra: Requires correlation between diode dose-rates: Compare with calculated ratio No correlation (unused) Determine spectral folding energy
SREM Data • Derivation of flux not part of this study • SREM fluxes calculated by NOA using SVD analysis of 15 SREM channels (proton + electron) • E.g.: Electron Flux Minimal contamination outside Van Allen belt
Merlin-SURF vs. Cedex Good differential flux agreement at 1 MeV and 2 MeV: 1 MeV 2 MeV Shielded Cedex diodes only useable in high flux periods
Merlin-SURF vs. Cedex • Better agreement with SURF spectra during high flux periods: High flux only All flux → Cedex deemed less reliable in low flux periods
Merlin-SURF vs. SREM • Good agreement, especially during high flux periods (equatorial crossings where L~5):
Merlin-SURF and SREM electron spectra cf. AE8 • Spectral comparison (equatorial): All instruments show harder spectrum than AE8 (but low confidence due to response function range) Better agreement with AE8 with longer SURF data coverage period
Task 2: Proton and Heavy Ion calibration and data processing • Data coverage periods: • Cedex & Merlin (Giove-A): December 2005 – July 2012 • SREM (Giove-B): April 2008 – July 2012 • Proton / Heavy ion instruments: • Cedex • Two Silicon Detectors: • Telescopic arrangement • LET range ~ 30 – 15,000 MeV.cm2/g • Merlin • Particle telescopes: • Single channel (>40 MeV) proton telescope) • Ion LET telescope – no data due to hardware defect • SREM • Three Silicon Detectors: • Telescopic arrangement • Deconvolution algorithm to separate electrons and protons
Merlin Proton Telescope Protons (>40 MeV flux) • Stacked diodes – diameter ~2 cm • Detects protons >40 MeV • Also detects electrons due to pile-up: Electron contamination when bottom SURF plate ≳0.02 pA/cm2 (no real proton signal in this period)
Solar Particle Events • Several SPEs measured (largest in 2012) Dips in measured proton flux due to geomagnetic shielding (correlate with equatorial peaks in electron intensity)
May 2012 SPE • Smaller event in May shows complex structure of proton flux with electron contamination Proton peak Dip (geomagnetic shielding) Electron contamination Electron contamination within dip SURF Bottom Plate
SREM Proton Flux • As with electron flux, need to de-convolve electron & proton contributions (done by NOA) • Electron contamination evident at equatorial crossings: Proton Flux Need to restrict proton analysis to periods outside electron belt (e.g. L>10) Electron contamination Electron contamination
2012 SPEs • >40 MeV proton flux calculated from SREM data for comparison to Merlin • E.g. January 2012: Reasonable agreement at peak flux Merlin < SREM at low flux
2012 SPEs March 2012 May 2012
Cedex LET Telescope • Two 3x3 cm, ~300 um thick PIN silicon detectors (under 2.5 mm copper dome) • No electron contamination: Dose Rate: Large increase in electron-induced dose does not result in significant increase in integral ion flux Ion flux:
LET Spectra • Counts binned into 512 linearly spaced LET channels • LET range: ~ 30 – 15,000 MeV.cm2/g Threshold used to exclude SPEs
LET Spectra - Comparison with Models Including SPEs: Quiet time: Reasonable agreement with CREME model
Long term variation • Inverse correlation between ion flux and solar cycle due to modulation of Galactic Cosmic Rays (GCR)
Ion Flux during SPEs • 2012 events measured • Dips during equatorial crossings visible: March 2012 May 2012 January 2012
Task 3: Radiation Belt Model Validation • Objectives: • Analyse Giove electron flux data and compare to models (e.g. AE8, MEO, FLUMIC, AE9) in order to identify deficiencies or inconsistencies • Examine data with respect to Galileo radiation environment specification - assess suitability for the mission • Data sets: • Electron fluxes derived from Merlin-SURF (2005 – 2012) - exponential and power-law spectra treated separately • Electron fluxes derived from SREM (2008 – 2012) • (Cedex-derived fluxes excluded as only available during high flux periods and low fidelity) • Focus on SURF data (longest data set and best traceability)
AE8 • AE8 (still) represents industry standard • Static model, no flux variability • Inner and outer belts (only latter applicable to Giove) Giove minimum L
Time Series Comparison • SREM differential flux cf. AE8: AE8 ‘confidence levels’ 0.7 MeV Reasonable agreement 2010 – 2012 period Big discrepancy during ‘electron desert’ period 1.4 MeV
Time Series Comparison • SURF differential flux cf. AE8: Exponential Spectrum Power-law Spectrum 0.5 MeV 1.5 MeV Longer SURF time period highlights unusual nature of electron desert
Spectral Comparison – AE8 • Mean long-term spectra derived from SREM and SURF data (excluding L>8 data) • AE8 spectrum averaged over Galileo-type orbit SREM: SREM < AE8 at low energies (and harder spectrum)
Spectral Comparison – AE8 • SURF spectra for exponential and power-law assumption (extended beyond optimum 0.5 – 3 MeV range for illustration) SURF power-law spectrum >AE8 at low energies SURF exponential spectrum < AE8 at low energies Both >AE8 at high energies – danger of extrapolation!
Spectral Comparison - FLUMIC • FLUMIC is a worst case daily-averaged electron flux model for internal charging • Comparison with representative low, medium and high flux periods for SREM and SURF fluxes (for statistical comparison see Task 4) • FLUMIC parameters: L=4.5, equatorial latitude, two representative dates (determines normalisation and folding energy) • ‘FLUMIC 1’ = September 2007, E0 = 0.48 MeV, ‘FLUMIC 2’ = January 2001, E0 = 0.28 MeV • Giove data imply FLUMIC is too soft (electron spectrum actually hardens during enhancements) • FLUMIC specification is exceeded at high energies (margin depends on extrapolation assumptions)
Spectral Parameters vs. Intensity • Relationship between spectral hardness and intensity of electron environment (applies to flux as a function of magnetic latitude and variation due to solar wind conditions) SURF (exponential spectrum) SURF (power–law spectrum) Folding energy increases with intensity (harder spectrum) Spectral index decreases with intensity (harder spectrum)
Galileo Environment Specification • Radiation environment specification addresses (primarily) concerns over ionising dose and internal charging • Specification w.r.t. models: Specification based on AE8 AE9 < AE8 in Galileo orbit (except at high E)
Galileo Environment Specification • With respect to Giove data: At 3 MeV only SURF power–law is above specification If extrapolated to higher energies, all Giove spectra exceed Galileo specification
Dose-Depth Varying spectra have significant consequences for dose-depth specification: (Dose for nominal 12 year period) Upper energy cut-off for these examples: SREM: 3.8 MeV SURF: 5.5 MeV However, this is highly sensitive to upper energy cut-off…
Dose-Depth – dependence on upper cut-off energy • Illustrative calculation for different (extrapolated) upper energy cut-offs: SURF upper cut-off varied from 3.5 - 10 MeV Very large difference with power-law spectrum above ~6 mm shielding (extrapolation unjustified?) Significant difference with exponential spectrum at ~8 mm shielding (but much less significant than power-law extrapolation)
Dose-Depth • What to conclude for Galileo environment specification? • Cannot justify simplistic extrapolation of spectra beyond ~3 MeV • However, also cannot justify truncating spectrum at 3 MeV for dose-depth calculation • Reasonable compromise: create composite dose-depth curve based on AE8 and ONERA’s Galileo specification model (based on GPS data but better agreement with Giove data than AE8) • Consequence for Galileo specification: ~doubling of dose at 8 mm shielding (unchanged <4 mm & > 12 mm)
Task 4: Model of Outer Belt Electrons for Dielectric Internal Charging (MOBE-DIC) • Energetic trapped electrons in Van Allen belts pose a threat to satellites through internal charging of dielectric materials: • The outer electron belt is extremely dynamic - large changes in flux occur over short timescales, driven by coronal holes and coronal mass ejections (CMEs) • Existing models to address internal charging: • FLUMIC: • Worst-case model for internal charging • Based primarily on GEO data (not near peak) • User-friendly but not up-to-date • AE9: • Successor to AE8 • Multiple data sources • Comprehensive statistics • Complex (many input parameters & run options) • Objective: A fast user-friendly model for internal charging specification (successor to FLUMIC)
Internal Charging • Multi-stage process: e.g. April 2010: >2 MeV flux at GEO increases by ~4 orders of magnitude in a few hours! Energy coupling into circuit Satellite anomaly / outage /failure Electrostatic charging of spacecraft materials Electrostatic discharge
Worst Case Statistics with Giove Data • Use derived flux time series to create cumulative distribution functions (CDFs) at discrete energies in the range 0.5 – 3 MeV (peak of instrument response) Fit baseline spectra at three percentage exceedance levels - 90%, 99%&100%: Create reduced series of average flux at equatorial peaks (L≈4.7) CDFs based on equatorial flux: (Note: harder spectra in more extreme events) NB SURF data used (2005 – 2012) These three spectra form the basis of the MOBE-DIC model (more in Hands et al. IEEE TNS 2015)
Extrapolating to other L-Shells • Equatorial spectra at L≈4.7 form the basis of the model • Need to derive profile of L-shell to extrapolate, however… • L-Shell profile is not stable, e.g.: AE9 AE8 FLUMIC Van Allen Probes, ERM (Maurer et al. 2013) SURF on STRV1d (Ryden et al. 2001) Van Allen Probes, REPT (Baker et al. 2014)
Extrapolating to other L-Shells (2) • Our approach is to use high-latitude SURF data • Inclination of Giove-A orbit means higher L shells only encountered at higher latitudes • Need to renormalise non-equatorial fluxes: EquatorialFlux All Flux L≈4.7 at equator Assume Vette function (like AE8 and FLUMIC) [Scaling is (slightly) L-dependent but not energy-dependent] Fit ‘envelope’ to renormalised data (at each energy) → Energy-dependent L-Shell profile