Download
1 / 20
200 likes | 223 Vues
Join the meeting to discuss the importance of climate change statistics for producers and users. Understand the need for comprehensive data, different user needs, and communication in sustainable development work.

E N D
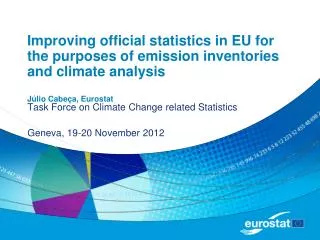
Scope of Climate Change Related Statistics Meeting on climate change related statistics for producers and users UNECE Task Force Geneva, Switzerland, 19-20 November 2012 Julie L. Hass, Ph.D. Statistics Norway
National Statistical Offices Ministries/Agency of Environment Research Institutes and consultants Others? GHG emissions inventories Environment statistics Other statistics – labor force, health Others? Who is attending this meeting? Work areas? Producer – User?
Why are we talking about this?- Need for comprehensive information/data - Many different needs, producers and users- Need for communication and coordination- Experience from work on Sustainable DevelopmentWhat are we talking about? … Change, Climate, Statistics/Official Statistics
What is “Change”? • Change – measured over time (Dy/Dx) • Statistical System’s core competence is the development and maintenance of data for consistent time series! • Seasonal adjustments • Temperature corrected • Monetary time series (“constant prices”) • Monetary comparisons between countries (Purchasing Power Standards)
What is “Climate”? • Climate is the description of the long-term pattern of weather in a particular area. • Average weather for a particular region and time period (typically 30 years)
Typically addressed from a natural science perspective Examples:Changes in global temperatureChange in sea levels What is “Climate Change” ?
UNFCCC – defines climate change • Article 1: “…a change of climate which is attributed directly or indirectly to human activity that alters the composition of the global atmosphere and which is in addition to natural climate variability observed over comparable time periods. • Through the UN Framework Convention on Climate Change programs to address this challenge are developed. • Focus on composition of the global atmosphere…especially on emissions of greenhouse gases
How does official statistics enter this picture? • Statistical systemfocuses mostly on activities from a human perspective • Built originally with a focus on sectorpolicy needs – such as agriculture or education policy
Climate Change related Statistics • New user groups – with different user needs • New types of analyses are needed • Statistical system – multi-purpose data systems serving user needs: Collect data once, use many times • New uses for some existing statistics: • Foundation for the calculations for greenhouse gas emissions
Greenhouse gas emissions inventories:Foundation from Official Statistics Pollution / emissions registers Production Statistics Economic Statistics Energy Statistics Land use / cover Agriculture Statistics Waste Statistics Forestry Statistics TransportStatistics
Need from statistical system: (Activity Data) x (Emissions Factors) = Emissions physical unit Emissions/physical unit Typically from statistics
Agriculture Grazing patterns, Manure management Numbers, types and ages of livestock Types of crops
Use/improve existing information rather than establish new reporting systems The Statistical System… • is the only world-wide, comprehensive, multi-layer information system covering a spectrum of social, economic, environmental and institutional themes. • has the responsibility for and control over definitions, classifications, nomenclatures, methodologies, accounting standards and data quality. • needs to know what is being used and anticipate future needs for data use and analysis.
Health statistics • Re-occurrence of diseases no longer in areas, for example malaria in Europe • New diseases • Changes in current trends “Extreme events” (heat waves, storms, etc.)
Water … or the lack of it And resulting land useland cover changes, and soil degradation.
Jobs… “Green Jobs”
Population / Demographics / MigrationTypes of “households”
Boundaries for Climate Change related Statistics • What to include and exclude? • Is everything related to climate change? • Explored this using different frameworks to see if these could help us determine the definition / boundary / scope of climate change related statistics. • Driving forces – Pressure – State – Impacts – Response (DPSIR) • Mitigation, impact and adaptation • Framework for the Development of Environmental Statistics (FDES) • Natural capital