Download
1 / 18
180 likes | 280 Vues
Explore the effects of climate change in Belgium, Estonia, Germany, Hungary, Iceland, Norway, and Scotland. Learn about temperature increases, precipitation changes, and glacier retreats in these countries over the 20th and 21st centuries.

E N D
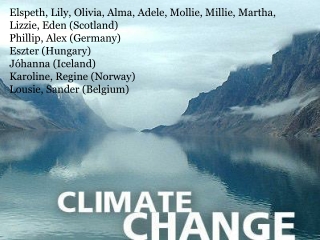
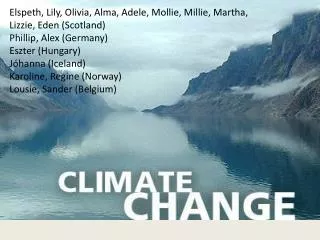
Elspeth, Lily, Olivia, Alma, Adele, Mollie, Millie, Martha, Lizzie, Eden (Scotland) Phillip, Alex (Germany) Eszter (Hungary) Jóhanna (Iceland) Karoline, Regine (Norway) Lousie, Sander (Belgium)
Belgium • In Belgium, over the course of the 20th century, there were very marked and quite severe increases in seasonal and annual temperatures (in the order of 1°C) during two periods, firstly during the first half of the 20th century and then In the 1980s • the frequency of cold spells reduced significantly in the early 1970s. The general increase in minimal temperatures during the 20th century also explains why the longest annual period without frost has increased • Between 1833, when rainfall records began, and the end of the 20th century, the Brussels region has seen an increase of roughly 7% in annual rainfall
Estonia • Estonia lies in the transition zone between maritime and continental climate. Local climatic differences are due, above all, to the neighbouring Baltic Sea, which warms up the coastal zone in winter and has a cooling effect, especially in spring. • The most intensive warming to date has taken place in March, April, and May, with a gradient of 1.5ºC per 100 years • Since 1966 precipitation series in Estonia have been massive. A significant increase in precipitation has occurred in winter period (29%). During the period 1961–2004 the winter seasonal precipitation increased over 45 mm.
Germany • The annual average temperature increased by ca. 0.8 to 1.0ºC between 1900 and 2000. After a cooling trend up to the 1970s,we now observe a continuous and rapid temperature increase that still continues today • The intensity and frequency of occurrence of extreme rainfall events have increased especially during the last forty years of the 20th century. In general, this trend is more pronounced in the winter than in the summer • The probability of occurrence of an extremely hot summer, such as in the year 2003, has increased in the course of the 20th century
Hungary Precipitation Its annual amount significantly decreased in the 20th century. Thisis most significant during spring when it is only 75% of the sum in the beginning of the 20th century The autumn and winter precipitation decrease is 12-14%. The winter precipitation is the lowest in comparison to the other seasons. Temperature The number of frosty days is expected to decrease with 12-15 days by 2040 compared to the period between 1961-1990, everywhere – more in higher altitudes Fewer frosty days will result in a decrease in heat consumption higher temperatures mean a shorter heating period. The number of days with high heat alert will increase The largest temperature increase is expected in summer, and the smallest increase in spring. The expected summer warming of Hungary in 2071- 2100 compared with 1961-1990 ranges from 4.5-5.1°C 3.7-4.2°C . In case of spring, the expected increase inside Hungary is 2.9-3.2°C
Iceland • Iceland enjoys a warmer climate than its northerly location would indicate because a part of the Gulf Stream flows around the southern and western coasts of the country. Reykjavik has a cool climate; with annual temperatures similar to those of Toronto or New York. However, it does still get cold in Reykjavik. • In addition, the result of mixing the warm, moist Atlantic air with the cold, dry Arctic air produces a weather pattern that is constantly changing. The annual temperature of Reykjavik is 5°C, with the average January temperature being -0.4°C and July 11.2°C. The temperature records for Reykjavík are 24.8°C (76.6°F) on August 11, 2004 and -24.5°C (-12.1°F) on January 21, 1918 (1). • In the 1920s there was a period of rapid warming, similar to what is observed in global averages, but in Iceland the temperature change was greater and more abrupt. Since the 1980's, Iceland has experienced considerable warming, and early in the 21st century temperatures reached values comparable to those observed in the 1930s.
Norway • For the period 1900-2008 as a whole, the annual mean temperature in Norway has increased by about 0.9°C • The annual precipitation has increased in Norway during 1900-2008# • Snow cover has decreased in the northern hemisphere for the past 50 years • Snowfall depends strongly on temperature and precipitation. In Norway,these have increased during winter in the past few decades. • The Norwegian coastal glaciers, which were expanding and gaining mass due to increased snowfall in winter up to the end of the 1990s, are also now retreating, as a result of less winter precipitation and more summer melting (12, 13). Nearly all the smaller Norwegian glaciers are likely to disappear and overall glacier area as well as volume may be reduced by about one third by 2100
Scotland • The Gulf Stream has a warming effect on the UK, especially bringing mild winters for its latitude. • From 1901 to 1999, annual mean CET temperatures showed a warming of +0.6°C over this period. The warming has been greatest from mid-summer to late autumn. • Temperatures in Wales, Scotland and Northern Ireland have risen by about 0.7–0.8ºC since about 1980. • Scotland is on average 20% wetter then it was in 1961
Fuel Economy • Highway vehicles release about 1.5 billion metric tons of greenhouse gases (GHGs) into the atmosphere each year. • You can reduce them by: • Choosing a car with better gas mileage • Getting the best fuel economy out of your car • Using a low-carbon fuel such as ethanol or CNG • Walking, biking or taking public transport more often • Combining trips when possible
Clean Energy • Two thirds of all energy going into the UK’s power stations is lost as waste heat energy. If we captured this heat, it would be enough of to heat every building and business in the UK. • To capture this energy we would need to start using smaller plants, however, by making these changes we could double the efficiency of our power stations, slash our carbon emissions and reduce our reliance on foreign gas.
In The Home • Domestic usage accounts for 15% of the UK’s carbon emissions. • There are many simple solutions that onecan do such as switching to energy efficient bulbs and fitting insulation in the loft, etc. • But we can go further by decentralising our energy systems. By installing small scale solar and wind generators we can make our own power and even sell our excess energy to top neighbours etc.
Industry • In 2005 the EU Emissions Trading Scheme (EU ETS) was set up to tackle emissions from industry, which accounts for almost a quarter of the UK’s carbon emissions. • The ETS requires companies to either reduce their emissions or buy carbon credits from other companies that have exceeded their targets.
Top Ten Small Solutions • Reduce, Reuse, Recycle • Use Less Heat and Air Conditioning • Change Light Bulbs to Fluorescent • Drive Less and Drive Smart • Buy Energy-Efficient Products • Use Less Hot Water • Use the “OFF” Button • Plant a Tree • Manage Your Utilities • Encourage Others to Conserve http://www.youtube.com/watch?v=OqVyRa1iuMc
“It’s virtually certain that human activities are responsible for the changes in climate that we’ve been seeing over the past 50 years.” In 50 years…
Climate in 50 years time… • Persistent emissions of greenhouse gases will lead to increasing levels of climate change; this can include atmospheric warming, rising acidity levels in the ocean, rising sea levels, and changing precipitation patterns. • The extent of future climate change is dependent on what we do now to reduce global warming. The more global warming we cause, the larger the changes will be.
References • http://www.epa.gov/climatechange/science/future.html • http://www.50yearforecast.org/ • http://www.telegraph.co.uk/earth/earthnews/6236690/Met-Office-catastrophic-climate-change-could-happen-with-50-years.html • http://www.climateadaptation.eu/ • http://www.greenpeace.org.uk/climate/solutions • http://environment.about.com/od/globalwarming/tp/globalwarmtips.htm • http://www.fueleconomy.gov/feg/climate.shtml • http://en.wikipedia.org/wiki/Effects_of_climate_change_on_humans • http://www.theguardian.com/environment/2012/sep/19/climate-change-affect-food-production • http://www.scientificamerican.com/article.cfm?id=population-growth-climate-change • http://www.greenpeace.org/international/en/campaigns/climate-change/impacts/sea_level_rise/