Understanding Livestock Marketing: Key Factors for Successful Sales and Pricing
220 likes | 328 Vues
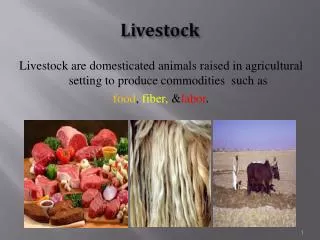
This comprehensive guide delves into the essential aspects of livestock marketing, focusing on when and what to sell, pricing strategies, and market types. It highlights the importance of animal weight, grade, and production costs while emphasizing optimal selling conditions. Key topics include value-based marketing, current market trends, and the impact of genetic potential on pricing. Additionally, it provides insights into feeder cattle and hog sales, auction processes, and the significance of dressing percentages and carcass evaluations.

Understanding Livestock Marketing: Key Factors for Successful Sales and Pricing
E N D
Presentation Transcript
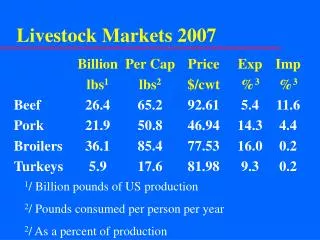
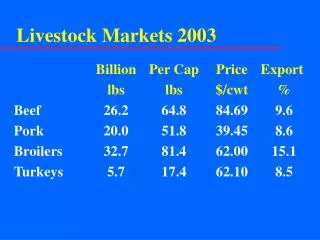
Livestock Markets 2003 Billion Per Cap Price Export lbs lbs $/cwt % Beef 26.2 64.8 84.69 9.6 Pork 20.0 51.8 39.45 8.6 Broilers 32.7 81.4 62.00 15.1 Turkeys 5.7 17.4 62.10 8.5
Livestock Marketing • When to sell • Weight, grade, costs • What to sell • Live or carcass • Grade, production • Where to sell • Type of market • Location
When to sell • Classic production function • MC=MR • Costs increase beyond optimal selling weight • Costs are a function of • Genetic potential • Cost of diet • Opportunity costs of future production
When to sell • Marginal Revenue (Prices) • Uncertain about price if you wait to sell (price trends) • Function of weight and days on feed • Typically animals increase the portion of fat relative to muscle produced as they get heavier. • There is an optimal weight range • Discounts if too light or too heavy • Optimal degree of “finish” • Different for hogs versus cattle • Both can be too fat
When to sell • Optimal is still MC=MR • MC is increasing at increasing rate and is function of feed prices • MR increases then decreases due to premiums and discounts associated with grades • Is also a function of seasonal price trends that could be higher or lower
Market Hog Calculator Current hog price ($/cwt) HP $47.95 Expected added wt AW 15 Cost of added wt ($/lb) AC $0.37 Expected final wt FW 260 Price discount ($/cwt) PD ($0.75) Expected price change PC $0.00 AW*HP – (AW*AC) – (FW*PD) + (FW*PC) Expected return to selling later ($0.27)
Where to sell • Terminal markets have declined • Auction markets important when assembly is needed • Feeder cattle and cull cows • Growing interest in fed cattle in fringe areas • Direct sales • Fed cattle and hogs • Feeder pigs • Growing in feeder cattle where source verification is important
Feeder cattle sales • Live weight sales • Various weight classes • Auction is major market • Assembly function important • Video auctions • Direct trade • Premium paid for • Large uniform lots • Certification/verification ??????
Feeder pig sales • Price/head or live weight • 40-60 pound classes • Weaned pigs (10-12 pounds) • Primarily direct trade • Rapidly declining auctions • Health and stress concerns • Premiums for • Large uniform, single source • Genetic history
What to sell • Live weight • One average price for all live pounds • Negotiated price before delivery • Weighing conditions important • Mud, shrink (fill, time, stress) • Was most common for hogs • Still common in large cattle feedlots, less in Iowa • Used for feeder cattle and feeder pigs
What to sell • Carcass weight • One average price for all carcass pounds • Negotiated price before delivery • Dressing percent (also called yield) • Farmer stands risk of trimming and condemnation • Common for fed cattle in Midwest
What to sell • Dressing percent • DP = carcass weight / live weight • DP hogs approximately 73-76% • DP cattle approximately 61-64% • DP impacted by: • Weighing conditions • Shrink
What to sell • Value-based marketing • Each carcass evaluated and priced • Premiums and discounts determined ahead of delivery • Base price may be negotiated or come from formula • Carcasses are graded and values assigned • Farmer stands grading risk • Different buyers have different systems • Nearly all hogs • Increasingly popular for fed cattle
Value-based Hog Marketing • Two factors impact premiums • Carcass weight and leanness • Fixed premiums (known dollar amount) • Relative premiums (percent adjustment) • Not USDA graded • Packer employee measures • Objective measures • Fat-O-Meter, ruler, ultra-sound
Comparing bids Price in appropriate $/cwt A B Bid Price (live) $44.50 --- Bid Price (carcass) --- $59.50 Lean premium --- +1.25 Sort discount --- -.70 Dressing percentage 74.5 74.5 Adjusted to live 44.50 44.73 Transportation -.85 -.35 Net farm gate price $43.65 $44.38
Value-Based Cattle Marketing Three factor impact premiums 1. Carcass Weights 2. Quality Grade Distribution (USDA Grader) Based on marbling, proxy for eating experience 3. Yield Grade Distribution (USDA Grader) Based on lean meat yield 4. Other specs: Product safety & quality assurance Acceptable color Youthfulness
Value-Based Cattle Marketing Common Ground for Targets 1. Carcass Weights 550 - 950 lbs 2. Quality Grade > Se+ or > Ch0 3. Yield Grade 1’s and 2’s
Where are the Grid Rewards & Discounts? • Angus America (Excel) • Premiums: • Prime: $6 / cwt • Certified Angus: $3 / cwt • Sterling Silver: $3 / cwt • Angus Pride: $.50/cwt • Yield Grade 1: $5 / cwt (Ch & better) • Yield Grade 2: $3 / cwt (Ch & better) • Discounts: • Selects, No Rolls, Standards (Mkt Boxed Beef Prior, -$10 off Select, -$30) • Off Grades (-$35) • Yield Grade 4s & 5s (-$15, -$25) • Heavy(950-999), Extra Heavy (1000up), Light (500-550) & Extra Light (500 down) Carcasses (-$15, -$30, -$15, -$35)
Comparing Bids Price in appropriate $/cwt A B Base bid price 112.00 111.00 Prime 3% --- +6.00 Top 2/3 Ch 45% --- +3.50 Select 30% --- -8.00 Yield 1&2 60% --- +2.50 Off weight 3% --- -15.00 Transportation -.65 -1.25 Net farm gate price 110.35 110.16 Bid A is a straight in the meat bid, Bid B is a valued-based bid.
Summary • When to sell is complicated • Perishable, non-storable • Rising cost and changing value • What to sell is complicated • Understanding shrink • Know what is under the hide • Where to sell • Transportation • Buyer programs • Number of bidders