Download
1 / 16
160 likes | 243 Vues
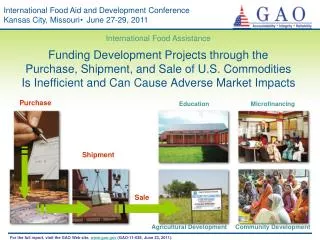
International Food Aid and Development Conference Kansas City, Missouri June 27-29, 2011. International Food Assistance. Funding Development Projects through the Purchase, Shipment, and Sale of U.S. Commodities Is Inefficient and Can Cause Adverse Market Impacts. Purchase. Education.

E N D
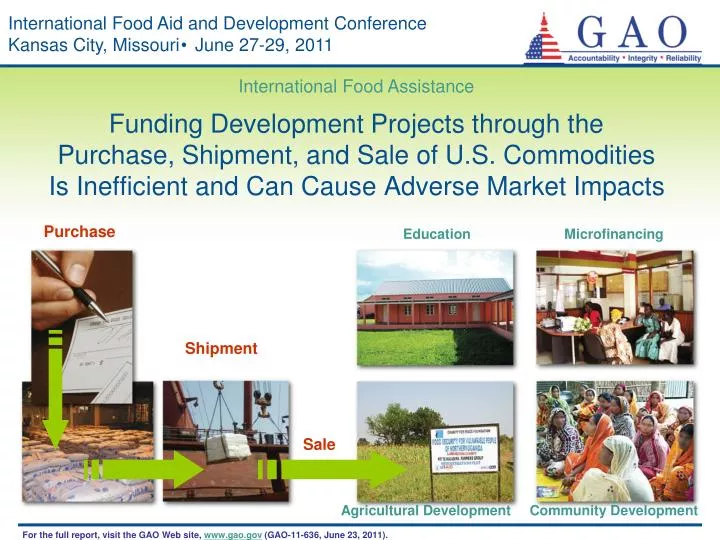
International Food Aid and Development Conference Kansas City, Missouri June 27-29, 2011 International Food Assistance Funding Development Projects through the Purchase, Shipment, and Sale of U.S. CommoditiesIs Inefficient and Can Cause Adverse Market Impacts Purchase Education Microfinancing Shipment Sale Agricultural Development Community Development For the full report, visit the GAO Web site, www.gao.gov (GAO-11-636, June 23, 2011).
Objectives 1. Assessed the extent to which monetization proceeds cover commodity and other associated costs. 2. Examined the extent to which U.S. agencies meet requirements to ensure that monetization does not cause adverse market impacts.
Scope and Methodology Analyzed food aid program data provided by the U.S. Agency for International Development (USAID), U.S. Department of Agriculture (USDA), and USDA’s Kansas City Commodity Office (KCCO). For USAID, we were able to use 189 of the 194 monetization transactions reported between fiscal years 2008 and 2010 (99 percent). For USDA, we were able to use 61 of the 66 monetization transactions reported between fiscal years 2007 and 2009 (92 percent). Examined differences between U.S.-and foreign-flag ocean freight rates, using KCCO data. Reviewed agency data such as market assessments, volumes programmed for monetization, import data, consumption data and the limits set by the agencies for monetization in recipient countries. Conducted field work in countries that programmed some of the highest volumes of monetized nonemergency U.S. food aid from fiscal years 2008 through 2010—Bangladesh, Mozambique, and Uganda. Conducted a structured interview survey of nongovernmental organizations (NGO) that monetized between fiscal years 2008 and 2010 and received a 100 percent response rate. Conducted this performance audit from July 2010 to June 2011 in accordance with generally accepted government auditing standards. 3
Background: Percentage of Funding for Emergency and Nonemergency Food Aid and for Monetization, Fiscal Year 2010 • In FY 2010, the United States spent $2.3 billion to provide 2.5 million MT of food aid to food-insecure countries. • About $800 million was spent on nonemergency food aid—of which more than $300 million was used to procure and ship 540,000 MT of commodities to be monetized. Note: The total for funding does not add up to 100 percent due to rounding.
Background: Countries that Received Monetized Food Aid, Fiscal Years 2008 through 2010
Background: Steps in the Monetization Process from Grant Proposal to Development Project Completion Conceptual framework of the monetization process Steps in the monetization process
Objective 1:Difference in Funds Expended and Cash Proceeds Resulting from USAID and USDA Monetization USAID and USDA are not required to achieve a specific level of cost recovery. Instead, they are required to achieve reasonable market price, which has not been clearly defined.
Objective 1: Funding Generated for Development Projects Through Monetization Was Less than Originally Expended Source: GAO analysis of USAID and USDA data. aA weighted average, calculated by dividing the total sales proceeds by the total procurement and shipping costs. 8
Objective 1: Ocean Transportation Costs Can Reduce the Amount of Funding Generated through Monetization Share of Freight Costs and Costs of Cargo Preference for Monetized Food Aid, Fiscal Years 2008 through 2010 • Ocean transportation accounted about one-third of the cost to procure and ship monetized food aid. • The freight rate for food aid shipments on foreign-flag carriers cost on average $25 per ton less than U.S.-flag carriers, controlling for shipping routes, shipping time and term, and the type of commodities shipped.
Objective 2: Legal Requirements Limit Competitionand Potentially Reduce Food Aid Shipping Capacity, Leading to Higher Freight Rates Number of U.S.-Flag Vessels Awarded Food Aid Contracts Has Declined from Fiscal Years 2002 to 2010 • Food aid shipping competition may be further limited by the requirement in the Cargo Preference Act that foreign-built vessels that reflag into the U.S. registry wait 3 years before participating in the transportation of food aid cargo. • This requirement seeks to ensure that vessels transporting 75 percent of food aid are not only U.S.-flagged. but also constructed in U.S. shipyards.
Objective 2: USAID and USDA Cannot Ensure that Monetization Does Not Cause Adverse Market Impacts • USAID and USDA monetize at high volumes. Agencies recommend differing limits for monetization, and in some cases the volume of commodities programmed for monetization has exceeded recommended limits. • Market assessments to determine recommended monetization levels have weaknesses. • USAID’s Bellmon Estimation for Title II (BEST) assessments have been conducted for only a limited number of countries and do not include projection analyses. • USDA’s Usual Marketing Requirements (UMR) are not publicly shared and contain weaknesses (e.g., no information or source for values used to calculate consumption needs). • Post-monetization evaluations are notconducted. Without them, agencies cannot determine the actual impact monetization transactions may have had on the market.
Objective 2: High Volumes Programmed for Monetization in More than a Quarter of Cases May Have Increased the Risk of Displacing Commercial Trade Distribution of Total Volume Programmed for Monetization as a Percentage of Reported Commercial Imports, Fiscal Years 2008 through 2010 • Food aid programmed for monetization constituted more than 25 percent of commercial import volume in more than a quarter of cases, increasing the risk of displacing commercial trade from developed countries or regional partners— a cost that impacts U.S. agribusiness and other exporters of the same commodity. • Fintrac recommends that the total volume monetized of a given commodity should not exceed 10 percent of the commodity’s commercial import volume in a given country in a given year.
Objective 2: Agencies’ Recommended Limits for Monetization Differ, and the Volume of Commodities Programmed for Monetization Has In Some Cases Exceeded Those Limits Between Fiscal Years 2008 and 2010 • BEST analysis • USAID exceeded the recommended limits in 6 cases. • USDA exceeded the recommended limits in 2 cases. • UMR • USDA exceeded the recommended limits in 5 cases. • USAID exceeded the recommended limits in 10 cases. Examples: Malawi: wheat in 2008 • No BEST • UMR -18,100 (no programming allowed) • Volume programmed: USAID 9,140 + USDA 10,000 = Total 19,140 metric tons Malawi: wheat in 2009 • BEST maximum 8,000 metric tons • UMR maximum 29,200 metric tons • Volume programmed: USAID 21,140 + USDA 30,000 = Total 51,140 metric tons
Selected Results from Structured Interview Survey of Implementing Partners Among the top factors that hindered implementing partners when conducting monetization: (1) market uncertainty (2) delivery delays (3) shortage of buyers (4) lack of reliable market information (5) shortage of staff with market expertise Among the key steps that could improve the monetization process: (1) explore options for lowering transportation costs (2) provide support for NGOs when complications in the monetization process arise (3) assist in negotiating with host governments to provide tax and duty-free exemptions 14
Recommendations • jointly develop an agreed-upon benchmark or indicator to determine “reasonable market price” for sales of U.S. food aid for monetization; • monitor food aid sales transactions to ensure that the benchmark set to achieve “reasonable market price” in the country where the commodities are being sold is achieved, as required by law; • improve market assessments and coordinate to develop them in countries where both USAID and USDA may monetize; and • conduct market impact evaluations after monetization transactions have taken place to determine whether they caused adverse market impacts. USAID and USDA generally concurred with GAO’s recommendations and noted ongoing efforts and plans to address them.
Matter for Congressional Consideration Matter: GAO recommends that Congress consider amending the Cargo Preference Act of 1954 to eliminate the 3-year waiting period imposed onforeign vessels that acquire U.S.-flag registry before they are eligible for U.S. food aid cargos. This could potentially increase the number of U.S.-flag vessels eligible for carriage of preference food aid cargo, thereby increasing competition and possibly reducing costs. Agency Comments: DOT disagreed due to its concern that the statutory change might be detrimental to the U.S. maritime industry. GAO’s Evaluation: USAID and USDA have reported that, due to the declining size of the U.S.-flag commercial fleet, they are forced to compete with the Department of Defense and others for space aboard the few remaining U.S.-flag vessels, thereby limiting competition in transportation contracting and leading to higher freight rates. Food aid shipments on foreign-flag carriers cost the U.S. government, on average, $25 per ton less than U.S.-flag carriers. Although the 3-year requirement was established to provide employment opportunities to U.S. shipyards, since 2005, U.S. shipyards have built only two new U.S.-flag vessels appropriate for transporting food, and the vessels have not been awarded a food aid contract. The 3-year rule applies only to food aid and not to defense agencies and the U.S. Export-Import Bank. 16