Problem Solving & Prevention Workshop by Prof. Hewett
300 likes | 403 Vues
Join Professor James A. Hewett in exploring Root Cause Analysis and Failure Mode and Effect Analysis, with practical activities and resources for further study. Learn about applying RCA tools with real-world examples. Discover the anatomy of problems and their solving process.

Problem Solving & Prevention Workshop by Prof. Hewett
E N D
Presentation Transcript
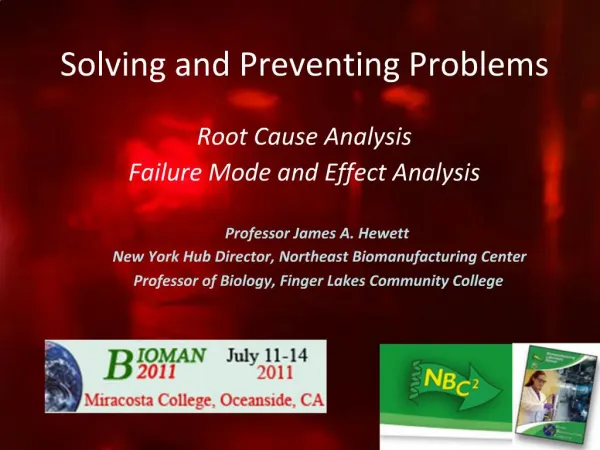
Solving and Preventing Problems Professor James A. Hewett New York Hub Director, Northeast Biomanufacturing Center Professor of Biology, Finger Lakes Community College Root Cause Analysis Failure Mode and Effect Analysis
Goals for Workshop • Introduce you to the concepts of RCA and FMEA • Review examples of where RCA tools are applied • Immerse you in some problem solving activities • Direct you to resources for further study (Note: We do not expect to make you RCA and FMEA experts)
RCA is a problem solving process A structured investigation that aims to identify the true cause of a problem and the actions necessary to eliminate it FMEA is a problem prevention process A tool that enables the identification and prevention of process or product errors before they occur
March 23rd, 2005Texas City, TX • BP refinery Isomerization unit startup • Liquid hydrocarbons released from blowdown drum • Subsequent vapor cloud explodes • 15 killed, 180 injured
Putting you to work(without “tools”) • Define the Problem • Identify Cause(s) • Which causes are at the ROOT (ultimate causes) • Suggest Potential Solutions for BP
BP’s RCA of the Texas City Event Fault or Logic Tree Analysis
Root Causes Senior executives: • inadequately addressed controlling major hazard risk. • did not provide effective safety culture leadership • did not provide resources to prevent major accidents BP Texas City Managers did not: • create an effective reporting and learning culture • ensure supervisors enforced plant policies and procedures. • incorporate good practice design in the operation of the ISOM unit. • ensure that operators were supervised and supported by experienced, technically trained personnel during unit startup • effectively incorporate human factor considerations in its training, staffing, and work schedule for operations personnel.
The Anatomy of a Problem and the Problem Solving Process in Industry • Analysis is a process and involves teams • Focus is on SOLUTIONS • Cause and Effect in NON-LINEAR • Contain Action and Conditional Causes • Facilitated by Process Thinking Tools
Problem Solving ISProcess Thinking In industry, assigned to teams of stakeholders Define Problem Brainstorm Causes RCA TOOLBOX Data Collection Data Analysis Root Cause Identification Problem Elimination RCA for CAPA Solution Implementation
Let’s Start SimpleWhat happened? What caused it? What is the solution?
Language and story-telling are linear, Cause and Effect is Non-linear • Pain CB • Injury CB • Fall CB • Slipped CB • Wet surface CB • Leaky Valve • Solution = fix valve and clean up floor Did not see warning sign Lettering on sign damaged Poor Placement of sign Lack of employee training Replacement schedule not followed Cost cutting program Solutions are also non-linear
Always at least TWO causes Action Causes = Triggers Conditional Causes = Pre-existing conditions Oxygen Oily Rags FIRE Match
It is too easy to focus on action causes • CONDITIONAL • Oxygen in the atmosphere • Oily rags not confined and properly disposed • Lack of no smoking signs in area • Lack of mandatory employee safety training • Lack of mandatory safety inspections • ACTION • Match strike: employee sneaks a smoke and burns down warehouse • WHAT IS THE SOLUTION ?
Lack of Focus on Solutions AVOID THE BLAME GAME
Root Cause Analysis (RCA) Example Why are CCs not implementing recommended biology curriculum reform recommendations? • Solutions require an analysis of root causes. • Many reports are solution driven and not focused on root causes. • RCA: Identify conditions (causes) and then keep asking WHY? • Every recommended reform effort should connect to a root cause, and presented with a solution that can be implemented…ie. HOW?
Simple Example • Conditional Cause: My administration is not supportive of implementing the reform recommendations at my institution. • Action Cause: I asked for release time to develop a project and my administration said: “No” • Published Solution: Community Colleges must get institutional “buy in” and administrative support for reform of science curricula. • Great . . . . . . . . . HOW? • Focus: WHY is the administration not supportive?
Survey of 40 Community Colleges that do NOT have undergraduate research programs • An Incompatible faculty model (ex. Teaching load) • Lack of faculty preparation (research and PBL) • Lack of access to a community of CC researchers • Lack of four-year school research collaborations • Insufficient Administrator Education Perez, J. 2003. Undergraduate Research at Two-Year Colleges. New Directions For Teaching And Learning; no. 93, Spring 2003 Results of RCA conducted at Finger Lakes Community College in Fall 2006 Integrated solution becomes a model for reform and an NSF CCLI proposal
Root Cause Analysis Tools • The Five Whys • Fish Bone Diagrams • Matrix Diagrams • Fault Tree Analysis
Five Whys or Why-Why • As always, define the problem • Identify a starting point (a causal level) • Ask Why (generates a new causal level) • Continue rounds of WHY • Look for “points of ignorance” • these are launching points for collecting more information or……. • ROOT CAUSES for developing solutions.
WHY- WHY • Contamination in Bioreactor – WHY? Filter Failed – WHY? Accidentally shipped as part of a bad lot – WHY? Employee mixed numbers on released lots – WHY? Inadequate lot tracking system – WHY? We have reached a Point of ignorance SOLUTION ?
Fishbone Diagram Assembling the Fish • At the head of the Fishbone is the defect or effect • The major bones are the capstones, or main groupings of causes. • The minor bones are detailed items under each capstone. • Common capstones: • People • Equipment • Material • Information • Methods/Procedures • Measurement • Environment • Test logic of bones: top-down OR bottom-up like: • this happens because of g; g happens because of f; f happens because of e; e happens because of d ….. Etc.
Matrix Diagrams • A graphical display of connections • A multivariate analysis tool • Uses weight measures to identify root causes • Variety of shapes • L-shaped most widely used and described here
Constructing the matrix • Identify problem characteristics and possible causes • Problem characteristics on one axis and possible causes on the other • Symbols used at intersections to weight impact • Sums presented to evaluate root causes