Measures of Development
430 likes | 531 Vues
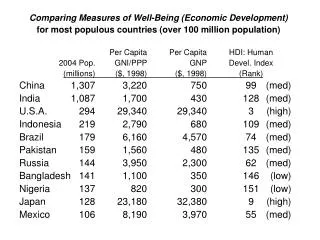
The Human Development Index assesses a country's development based on economic (GDP per capita), social (literacy rate & education), and demographic factors (life expectancy). Discover how different sectors of the economy impact development indicators and the significance of primary, secondary, tertiary, and quaternary sectors. Learn about the importance of productivity, raw materials, and consumer goods in driving economic growth. Explore social indicators like literacy rate, years in school, life expectancy, health expenditure, and infant mortality rates.

Measures of Development
E N D
Presentation Transcript
Human Development Index: recognizes a country’s development level as a function of • economics (GDP per capita), • social (literacy rate & level of education), and • demographic factors (life expectancy) • Highest possible rank is 1.0
Economic Indicator • GDP per capita: the value of the total output of goods and services produced in a country in a normal year divided by total population
GDP per Capita • European countries have the highest per capita GDP because of high GDP and low population. • Luxembourg – $79,000 • Norway - $53,300 • Africa the lowest per capita GDP due to low GDP and high population • Zimbabwe - $300 • DRC - $350
Other Economic Indicators • Sectors of the Economy • Productivity • Raw Materials • Consumer goods
Sectors of the Economy • Primary –lowest sector of sophistication. Involves extracting materials directly from the earth; mining, agriculture, fishing, and forestry • Higher % of population = greater chance of poverty
Sectors of the Economy • Secondary sector – manufacturing that transforms raw materials into useful products.
Sectors of the Economy • Tertiary – occupations based on providing services; tourism, restaurants, retail, etc. • Most MDCs have the majority of their economy in this sector. • Quantenary – service based occupations that are intellectual in nature; education, library services, government, etc. • Quinary – service based occupations that involve cutting edge technology
Make a Prediction • Regions that are primarily • Primary • Secondary • Tertiary
Primary Products The percentage of people working in agriculture exceeds 75% in many LDC’s of Africa and Asia. In Anglo-America and Western Europe the figure is <5%
Productivity • Value of a product in comparison to the labor needed to make it. • It is measured by assessing the value added per worker • Value added is the gross value of the product minus the costs of raw materials and energy • US has a value added of $80,000 in comparison to countries such as India at $500
Productivity • MDCs - produce more because of access to technology, tools, and equipment. • Money earned from the production reinvested into new technology increasing overall output. • LDCs must rely on animal and human power which does not allow them to produce anywhere near the level of MDCs.
Raw Materials • A country must have raw materials that can be fashioned into usable products • Countries such as the United States and Russia saw rapid industrial development due to an enormous amount of available resources. • Other countries such as the United Kingdom have had to establish colonies to replace depleted resources
Raw Materials • Other countries have lots of resources but foreign private industries are responsible for mining (Diamonds in South Africa).
Consumer Goods • Consumer goods help countries develop from the inside • Communication, Internet use, and motor vehicles help citizens communicate and transport resources and information • This helps to connect the resources and manufacturers which increases overall production
Consumer Goods • LDCs are not likely to have this equipment available. • creates a dichotomy between the urban dwellers who have this technology and the rural population that lacks it.
Social Indicators Literacy rate – the percentage of a country’s people who can read and write. • Literacy rates exceed 98% in MDCs • Amount of education – measured by taking the average number of years a student attends school in a country.
Demographic Indicators • Life expectancy • This is the average age of death for the citizenry • Because of better healthcare, people in MDCs tend to live 10-13 years longer than in LDCs.
Health and Welfare • MDCs are more capable of financing health and welfare than LDCs. • Most MDCs place more than 8% of their GDP into health care.
Infant Mortality • Because of the access to health and welfare services, infant mortality rates are usually less than 1% in MDCs compared to around 6% in LDCs. • This is also due to inadequate means of child delivery necessitated by the inability to access a proper physician.
Natural Increase rate • Rate at which the population increases • Around 1.5% in LDCs and .1% in MDCs • This causes social strain due to increased social cost. • Crude Birth rate • Rate at which children are being born into the population • LDCs face a rate around 24 per 1000 while MDCs are around 11 per 1,000 • Because LDCs death rate is 8 per 1000 this leads to an enormous increase in population
Make a Prediction • Which regions have a high HDI? • Low HDI?