
Uploaded by
sydnee-bennett
22 SLIDES
377 VUES
220LIKES
Code::Blocks Debugger Sample
DESCRIPTION
Code::Blocks Debugger Sample. 開啟 Code::Blocks. 開新的 project. 2. GO. 1. 選這個. 下一步. 下一步. 1. 這裡記得要全英文,神馬桌面啦程設啦通通不可以. 2. 下一步. Finish. 開好專案了,來這裡把 code 打開或貼上. 把 Code 寫在這或是貼過來這. 我貼 !!!!!!!!!!!!!!!!!!!!!!!!!. 點出小紅點,直接用滑鼠在圖上的位置戳戳戳戳戳就可以了. 就是現在,呼叫 Debuger. 出來了 !!! 黃色 箭頭 停 再 傳說 中的 程式 進入 點.
Download
1 / 22
Télécharger la présentation 
Code::Blocks Debugger Sample
An Image/Link below is provided (as is) to download presentation
Download Policy: Content on the Website is provided to you AS IS for your information and personal use and may not be sold / licensed / shared on other websites without getting consent from its author.
Content is provided to you AS IS for your information and personal use only.
Download presentation by click this link.
While downloading, if for some reason you are not able to download a presentation, the publisher may have deleted the file from their server.
During download, if you can't get a presentation, the file might be deleted by the publisher.
E N D
Presentation Transcript
2. GO 1.選這個
1.這裡記得要全英文,神馬桌面啦程設啦通通不可以1.這裡記得要全英文,神馬桌面啦程設啦通通不可以 2. 下一步
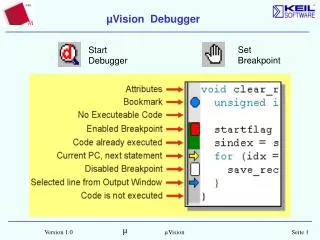
點出小紅點,直接用滑鼠在圖上的位置戳戳戳戳戳就可以了點出小紅點,直接用滑鼠在圖上的位置戳戳戳戳戳就可以了
出來了!!! 黃色箭頭 停再 傳說中的 程式進入點
1.原則上這邊就看的到了 2. 如果找不到左邊那個視窗,就來這裡把它打開
然後繼續F7就可以看到變數變化跟程式執行的狀況了然後繼續F7就可以看到變數變化跟程式執行的狀況了


More Related