Download
1 / 27
270 likes | 366 Vues
Discover the technologies meteorologists use to predict weather, including Doppler radar, weather stations, satellites, and high-speed computers. Learn how these tools help track storms, analyze data, and forecast weather patterns.

E N D
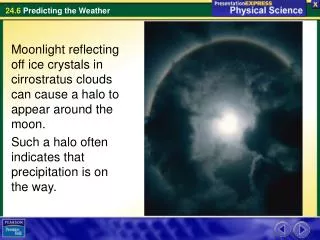
Moonlight reflecting off ice crystals in cirrostratus clouds can cause a halo to appear around the moon. Such a halo often indicates that precipitation is on the way.
What technologies help meteorologists predict the weather? Meteorologists are scientists who study weather. Meteorologists use many technologies to help predict the weather, including Doppler radar, automated weather stations, weather satellites, and high-speed computers. Weather Forecasting
Weather Forecasting Doppler Radar Doppler radar is a technology based on use of the Doppler effect. • Doppler radar bounces radio waves off particles of precipitation and measures the frequency of the returning waves. • The speed of the storm can be calculated from how much the frequency changes, so meteorologists can track the paths of thunderstorms and potential tornadoes.
Weather Forecasting Weather Stations and Satellites Automated weather stations gather information without a human observer being present. A typical weather station includes sensors that measure temperature, precipitation, and wind speed and direction. The information collected is transmitted as radio signals to a weather center.
Weather Forecasting These scientists are setting up an automatic weather station on an island in the Bigourdan Fjord, Antarctica.
Weather Forecasting Weather satellites orbit Earth to collect information about weather, including cloud cover, humidity, temperature, and wind speed. Meteorologists combine data from various weather stations and satellites to form a comprehensive view of a region’s weather.
Tracking the Weather Meteorologists track weather data closely to help produce accurate short-term forecasts and to understand longer-term variations in weather. The table provides the actual daily average temperature and daily precipitation for Minneapolis and St. Paul, Minnesota, for a seven-day period. Use the table and your knowledge of weather to answer the questions.
Tracking the Weather • Using TablesOn which day was the average daily temperature highest? On which day was it lowest?Answer:
Tracking the Weather • Using TablesOn which day was the average daily temperature highest? On which day was it lowest?Answer: Day 3 and Day 4; Day 7
Tracking the Weather • CalculatingThe average daily temperature on Day 7 was 11°C below normal. What is the normal temperature for that date? Answer:
Tracking the Weather • CalculatingThe average daily temperature on Day 7 was 11°C below normal. What is the normal temperature for that date? Answer: –2°C
Tracking the Weather • Using TablesWhat were the maximum and minimum average daily temperatures over the week? What was the temperature range? Answer:
Tracking the Weather • Using TablesWhat were the maximum and minimum average daily temperatures over the week? What was the temperature range? Answer: Maximum was –4°C; minimum was –13°C; range was 9°C.
Tracking the Weather • InferringWhat was the total precipitation over the seven days? What was the likely form of this precipitation?(Hint: Recall that the freezing point of water is 0°C.) Answer:
Tracking the Weather • InferringWhat was the total precipitation over the seven days? What was the likely form of this precipitation?(Hint: Recall that the freezing point of water is 0°C.) Answer: 34 cm; snow
Tracking the Weather • PredictingWhat type of front most likely passed through the region on Day 6 or Day 7? Predict the weather conditions that followed. Answer:
Tracking the Weather • PredictingWhat type of front most likely passed through the region on Day 6 or Day 7? Predict the weather conditions that followed. Answer: A cold front passed through, as seen from the heavy snow on Day 6 and the significant drop in temperature on Day 7. Cold temperatures and clear skies follow cold fronts.
Tracking the Weather • Making GeneralizationsSuppose you were visiting Minneapolis during this period. Describe how the weather changed during your visit. Answer:
Tracking the Weather • Making GeneralizationsSuppose you were visiting Minneapolis during this period. Describe how the weather changed during your visit. Answer: A week of chilly weather, with temperatures becoming even colder on Day 7. Two days of heavy snow and light snow on three other days.
Weather Forecasting High-Speed Computers High-speed computers help meteorologists compile and analyze the tremendous amount of weather data collected every day. With these data, scientists make forecasts. • Most forecasts can be quite accurate from 12 hours to 3 days. • Meteorologists can also accurately forecast the movement of large weather systems over a period of 3 to 7 days. • Predicting beyond a week is extremely difficult.
Weather Forecasting Meteorologists use computers to help forecast the weather.
How do meteorologists show information on weather maps? Weather maps typically show predicted temperatures and include sun or cloud symbols to indicate cloud cover. They have drawings of rain or snow to show areas of precipitation. Weather Maps
Weather Maps To help analyze weather data, meteorologists make maps that show weather patterns of different regions and symbols for the different kinds of fronts and areas of high and low pressure.
Weather Maps A comprehensive weather map typically includes information about weather systems and fronts. • Isotherms are lines that connect points of equal air temperature. • An isobar is a line that connects points of equal air pressure.
Weather Maps The isobars on this weather map encircle the centers of low-pressure and high-pressure systems.
Assessment Questions • Which technology is used to measure the motion of storms? • Doppler radar • automated weather stations • computers • barometer
Assessment Questions • Which technology is used to measure the motion of storms? • Doppler radar • automated weather stations • computers • barometerANS: A