Download
1 / 16
160 likes | 252 Vues
Explore the latest research on obesity and physical activity rates, including insights on racial disparities, environmental influences, and trends in health behaviors. Discover how behaviors like active screen time impact overall health and learn about recommendations for children's physical activity. Analyze data from national surveys and studies to understand the current state of obesity and inactivity in different populations. Stay informed on potential causes and solutions to combat the obesity epidemic in the United States.

E N D
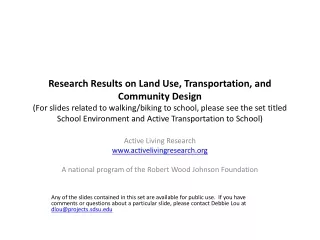
Research Results on Obesity and Physical Activity Rates and Other Findings(Other findings include active screen time and sitting) Active Living Research www.activelivingresearch.org A national program of the Robert Wood Johnson Foundation Any of the slides contained in this set are available for public use. If you have comments or questions about a particular slide, please contact Debbie Lou at dlou@projects.sdsu.edu
Data from the national BRFSS survey show racial-ethnic minority groups are less likely to be physically active than Whites. Rates of physical inactivity are highest among African Americans and Hispanics. Centers for Disease Control and Prevention. Trends in leisure-time physical inactivity by age, sex, and race/ethnicity—United States, 1994-2004. Morbidity and Mortality Weekly Report 2005; 54(39):991-994.
Older adults report significantly higher average physical activity levels when certain neighborhood built environment amenities are present 160 134 132 140 124 122 120 118 118 117 112 120 106 106 106 106 103 105 99 97 90 100 Absent 80 Present Average PASE score 60 40 20 0 Hills Street lights Golf courses Public parks Skating rinks Tennis courts Swimming pools Biking lanes/trails Walking/hiking trails Absence or presence of environmental characteristics Chad KE, Reeder BA, et al. Profile of physical activity levels in community-dwelling older adults. Medicine & Science in Sports and Exercise 2005; 37:1774-1784. Self-reported PA levels collected in 2002 from 764 adults ages 50 to 80+ living in a Canadian city are related to multiple environmental attributes. * PA measured by PASE (Physical Activity Scale for the Elderly) includes activities commonly engaged in by elderly people, including gardening, housework, and caring for others, in addition to walking and other leisure activities.
Since the 1970s, the percentage of children and youth ages 2 to 19 years who are obese has tripled. The increase is greatest among African-American and Low-income children. Anderson PM, Butcher KF. Childhood obesity: Trends and potential causes. The Future of Children: Childhood Obesity 2006; 16 (1): 19-46.
The Surgeon General recommends that children engage in at least 60 minutes of moderate physical activity most days of the week. Yet, according to 2006 estimates, nearly 2/3 of adolescents do not meet this recommendation, based on self-reports. Eaton DK, Kann L, Kinchen S, et al. Youth Risk Behavior Surveillance-United States, 2005. Surveillance Summaries, [June 9]. Morbidity and Mortality Weekly Report 2006; 55(SS-5), 1–108.
Children who play video games that require physical activity can burn up to eight times as many calories as children who engage in sedentary screen time. For example, one study found that children burned 90 calories more per hour while playing Dance Dance Revolution than did children who played inactive video games. Lanningham-Foster L, Jensen TB, et al. Energy expenditure of sedentary screen time compared with active screen time for children. Pediatrics 2006; 118(6):1831-1835.
A 2006 cross-sectional national study of 8th and 10th grade students* (N=39,011)found more black and Hispanic youth being overweight than white youth at most every socioeconomic (SES) level. Frequent exercise was associated with a lower likelihood of being overweight for all groups. referent *Based on self-reported data from the University of Michigan’s Monitoring the Future Project ** Defined as being at or above the 85th percentile Delva J, Johnston LD, O’Malley PM. The epidemiology of overweight and related lifestyle behaviors: Racial/ethnic and socioeconomic status differences among American youth. American Journal Preventive Medicine 2007;33(4S): S178-S186.
Increase in percentage of adults ages 20+ who are obese since the 1970s [Based on NHANES data] Ogden CL, Carroll MD, McDowell MA, Flegal KM. Obesity among adults in the United States— no change since 2003–2004. NCHS data brief no 1. Hyattsville, MD: National Center for Health Statistics. 2007. http://www.cdc.gov/nchs/data/databriefs/db01.pdf f
Data from the 2001-2002 Add Health Study show rates of overweight and obesity are highest among women, Native American, Hispanic, and African-American populations. Wang Y, Beydoun MA. The obesity epidemic in the United States—gender, age, socioeconomic, racial/ethnic, and geographic characteristics: a systematic review and meta-regression analysis. Epidemiologic Reviews 2007; 29(1):6-28.
NHANES data from 2003-2004 show the percentage of youth ages 6 to 19 meeting recommended physical activity guidelines declines significantly with age. Troiano RP, Berrigan D, et al. Physical activity in the United States measured by accelerometer. Medicine & Science In Sports & Exercise 2008; 40(1):181-188.
Deaths attributable to individual risks (thousands) in both sexes Danaei G, Ding EL, Mozafarrian D, et al. The preventable causes of death in the United States: Comparative risk assessment of dietary, lifestyle, and metabolic risk factors. PLoS Medicine 2009; 6(4): http://www.plosmedicine.org/article/info:doi/10.1371/journal.pmed.1000058
A study of children (N=333 from the Iowa Bone Development Study) found that children who were most active* at age 5 had significantly lower fat mass at age 8 and age 11 than children who were the least active at age 5. • *Minutes per day spent in moderate to vigorous physical activity (MVPA) measured with accelerometers • Janz KF, Kwon S, Letuchy EM, et al. Sustained effect of early physical activity on body fat mass in older children. American Journal of Preventive Medicine, 2009; 37(1):35-40.
A Canadian study (N=17,013) found that people who spend more time sitting are at higher risk for mortality from all causes Katzmarzyk PT, Church TS, Craig CL, et al. Sitting time and mortality from all causes, cardiovascular disease, and cancer. Medicine and Science in Sports and Exercise, 2009: 998-1005.
Adult Obesity Rates and Trends, 2009 Adult obesity rates continued to rise in 23 states. Rates did not decrease in any state. Thirty-one states have adult obesity rates above 25%. In Mississippi, Alabama, West Virginia, and Tennessee, adult obesity rates are above 30%. Trust for America’s Health. F as in Fat 2009: How obesity policies are failing America, July 2009. http://healthyamericans.org/reports/obesity2009/ http://healthyamericans.org/reports/obesity2009/
Data from the 2000 to 2003 National Health Interview Survey reveal that all Hispanic groups were more likely to have no leisure-time physical activity (LTPA) than non-Hispanic Whites, and that there are significant differences in levels of no activity among Hispanic sub-groups. Neighbors C, Marquez D, Marcus B. Leisure-time physical activity disparities among Hispanic subgroups in the United States. American Journal of Public Health, 2008; 98(8): 1460-1464.
Reduction in Calories Burned at Work is Related to Increase in Obesity since the 1960s A national study examined the relationship between the prevalence of obesity and reductions in calories burned during work from 1960 to 2006. The study predicted that, given a baseline weight of 76.9 kg in 1960-62 for men, a drop of 142 calories would result in an increase in average weight to 89.7 kg, which closely matched the actual average weight (according to NHANES data) of 91.8 kg in 2003-06. The results were similar for women. Church TS et al. Trends over 5 Decades in U.S. Occupation-Related Physical Activity and Their Associations with Obesity. PLoS ONE 2011; 6(5):e19657.