Download
1 / 7
70 likes | 243 Vues
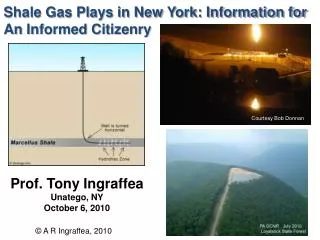
RANGE Resources. IPAA’s 7th Annual Oil and Gas Investment Symposium Shale Gas Economics. Mark D. Whitley Senior Vice President – Southwest & Engineering Technology September 30, 2009. Barnett Shale Well Economics. Core area – Tarrant, Denton, Johnson and NW Ellis Counties EUR – 3.0 Bcf

E N D
RANGE Resources IPAA’s 7th Annual Oil and Gas Investment Symposium Shale Gas Economics Mark D. Whitley Senior Vice President – Southwest & Engineering Technology September 30, 2009
Barnett Shale Well Economics Core area – Tarrant, Denton, Johnson and NW Ellis Counties EUR – 3.0 Bcf Capital – $2.6MM F&D – $1.14/mcfe NYMEX Price/Rate of return IRR Gas Price, $/mmbtu NYMEX
Marcellus Shale Well Economics Southwestern Pennsylvania – wet gas case EUR – 3.5 Bcfe Capital $3.5MM F&D – $1.16/mcfe NYMEX Price/Rate of return IRR (1) Gas Price, $/mmbtu NYMEX (1) Includes gathering, pipeline and processing costs
Shale Play Comparison • Type curves for Barnett, Fayetteville and Haynesville based on public production information • Type curve for Marcellus based on production results from 24 Range wells only
Shale Plays in General – Core vs. Non-Core Barnett Shale Gas Play Total Barnett Area = 27,714.199 mi2 Core Area = 2,911.505 mi2 Core Area Total Area = 10.5% Source: Range Resources
Breakeven Prices We estimate development wells in four L48 shale plays breakeven at prices below US$5.00/mcf
Forward-Looking Statements Statements concerning future capital expenditures, production volumes, reserve volumes, reserve values, resource potential, number of development and exploration projects, finding costs, operating costs, overhead costs, cash flow and earnings are forward-looking statements. These statements are based on assumptions concerning commodity prices, recompletions and drilling results, lease operating expenses, administrative expenses, interest and other financing costs that management believes are reasonable based on currently available information; however, management’s assumptions and the Company’s future performance are both subject to a wide range of business risks and there is no assurance that these results, goals and projections can or will be met. This presentation includes certain non-GAAP financial measures. Reconciliation and calculation schedules for the non-GAAP financial measures can be found on our website at www.rangeresources.com. The SEC has generally permitted oil and gas companies, in their filings made with the SEC, to disclose only proved reserves that a company has demonstrated by actual production or conclusive formation test to be economically and legally producible under existing economic and operating conditions. We use the terms “resource”, “potential” or “upside” or other descriptions of volumes of reserves potentially recoverable through additional drilling or recovery techniques that the SEC’s guidelines may prohibit us from including in filings with the SEC. These estimates are by their nature more speculative than estimates of proved reserves and accordingly are subject to substantially greater risk of being actually realized by the company.