Download
1 / 80
800 likes | 924 Vues
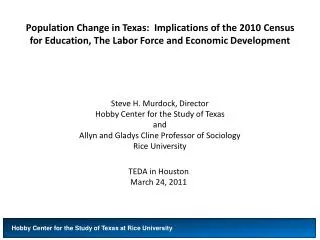
Population Change in Texas: Implications of the 2010 Census for Education, The Labor Force and Economic Development Steve H. Murdock, Director Hobby Center for the Study of Texas and Allyn and Gladys Cline Professor of Sociology Rice University. TEDA in Houston March 24, 2011.

E N D
Population Change in Texas: Implications of the 2010 Census for Education, The Labor Force and Economic Development Steve H. Murdock, DirectorHobby Center for the Study of Texasand Allyn and Gladys Cline Professor of SociologyRice University TEDA in Houston March 24, 2011 Hobby Center for the Study of Texas at Rice University
Major Topics of the Presentation__________________________ • Population Change • Increasing Racial/Ethnic Diversity • Aging of the Population • Implications of Demographic Change for Education, The Labor Force and Economic Development Hobby Center for the Study of Texas at Rice University
Total Population and Percent Population Changein Texas and the United States, 1850-2010 Hobby Center for the Study of Texas at Rice University
Regional Population Change as a Proportion of U.S. Population Change, 2000-2010 Hobby Center for the Study of Texas at Rice University
Texas Regional Councils of Governments
Councils of Governments in Texas Ranked by Total Population in 2010: Total Population in 2000 and 2010; Numeric and Percent Change, 2000-2010; and Percent of the State Population (2010) and State Population Change
Total Population in 2000 and 2010 in Metropolitan Statistical Areas in Texas Ranked by Numerical Change Between 2000 and 2010 Source: U.S. Census Bureau *Reflects total population for Texas portion of MSA only.
Population Change in Texas Counties, 1990-2000 Source: Texas State Data Center
Population, Population Change, and Proportion of the Total Population by Race/Ethnicity for the State of Texas, 2000 and 2010
Population, Population Change, and Proportion of the Adult Population (Age 18+) by Race/Ethnicity for Texas, 2000 and 2010
Population, Population Change, and Proportion of the Child Population (Age <18) by Race/Ethnicity for Texas, 2000 and 2010
Population, Population Change, and Proportion of the Total Population by Race/Ethnicity for the Houston-Galveston COG Region, 2000 and 2010
Population, Population Change, and Proportion of the Adult Population by Race/Ethnicity for the Houston-Galveston COG Region, 2000 and 2010
Population, Population Change, and Proportion of the Child Population by Race/Ethnicity for the Houston-Galveston COG Region, 2000 and 2010
Population, Population Change, and Proportion of the Total Population by Race/Ethnicity for the Houston-Sugar Land-Baytown MSA, 2000 and 2010
Population, Population Change, and Proportion of the Adult Population by Race/Ethnicity for the Houston-Sugar Land-Baytown MSA, 2000 and 2010
Population, Population Change, and Proportion of the Child Population by Race/Ethnicity for the Houston-Sugar Land-Baytown MSA, 2000 and 2010
Population, Population Change, and Proportion of the Total Population by Race/Ethnicity for the City of Houston, 2000 and 2010
Population, Population Change, and Proportion of the Adult Population by Race/Ethnicity for the City of Houston, 2000 and 2010
Population, Population Change, and Proportion of the Child Population by Race/Ethnicity for the City of Houston, 2000 and 2010
Median Age in the United States and Texas, 1900-2007 Hobby Center for the Study of Texas at Rice University
Percent of Texas Population by Age Groupand Ethnicity, 2000 Hobby Center for the Study of Texas at Rice University
Percent of Texas Population by Age Groupand Ethnicity, 2040* Hobby Center for the Study of Texas at Rice University
Percent of United States Population by Age Group and Ethnicity, 2000 Hobby Center for the Study of Texas at Rice University
Percent of United States Population by Age Group and Ethnicity, 2050 Hobby Center for the Study of Texas at Rice University
POPULATION CHARACTERISTICS AND SOCIOECONOMIC CONDITIONS Hobby Center for the Study of Texas at Rice University
Total and Percent of the Texas Population in Poverty and Median Household Income by Race/Ethnicity, 1999 and 2009 *In 2009 Dollars Source: U.S. Census Bureau, Census 2000 and American Community Survey, 2009
Educational Attainment in 2000 in Texas for Persons 25+ Years of Age By Race/Ethnicity_____________________________________ Percent Hobby Center for the Study of Texas at Rice University
Educational Attainment by Ethnicity in Texas, 2008 Source: American Community Survey, 2008 Hobby Center for the Study of Texas at Rice University
Average (Mean) SAT Scores for College Bound Seniors in the United States in 2001 by Selected Characteristics Hobby Center for the Study of Texas at Rice University
PROJECTIONS Hobby Center for the Study of Texas at Rice University
Projections of the U.S. Population by Race and Hispanic Origin: 2000 to 2050 Hobby Center for the Study of Texas at Rice University
Numeric Change in the Projected U.S. Population by Race and Hispanic Origin: 2000 to 2050 (in millions) Hobby Center for the Study of Texas at Rice University