Risk Management
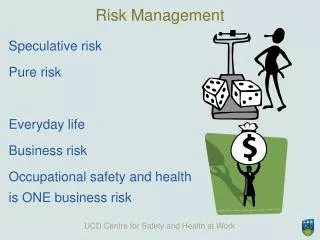
Risk Management. Jan Röman OM Technology Securities Systems AB. Why Risk Management?. Credit risk Market risk Liquidity risk Settlement risk Operation risk Legal risk. The risk that the counterpart will fail to fulfill his obligation.

Risk Management
E N D
Presentation Transcript
Risk Management Jan Röman OM Technology Securities Systems AB
Credit risk Market risk Liquidity risk Settlement risk Operation risk Legal risk The risk that the counterpart will fail to fulfill his obligation. The risk that movement in prices will result in loss. One part may not be able to transfer a position quick enough at a reasonable price. Unable to hedge.The risk that the counterpart can´t deliver the instruments at the expected time.The risk for losses due to human or system errors.The risk for losses due to the contracts are not legally enforceable or documented correctly. Types of Risk
Technology Risk Credit Risk Regulatory Risk Basis Risk Market Risk Tax Risk Political Risk Accounting Risk Interest Rate Risk Suitability Risk Prepayment Risk Legal Risk Optional Risk Volatility Risk Capital Risk Personnel Risk Reinvestment Risk Daylight Risk Concentration Risk Netting Risk Liquidity Risk Contract Risk Currency FX Risk Bankruptcy Risk Systems Risk Commodity Risk Collateral Risk Limit Risk Equity Risk Modelling Risk Rollover Risk Call Risk Cross-market Risk Hedging Risk Yield Curve Risk Systemic Risk Interpolation Risk Curve Fitting Risk Time Lag Risk Extrapolation Risk Raw Data Risk Knowledge Risk
Derivatives and Risk Derivatives = Financial instruments/contracts with values derived from the price of the underlying instrument. Designed to transfer and isolate risk. They play a valuable rule for users at the marketplace.
Sources of Financial Risk • Unexpected Underlying price changes • Unexpected Exchange rate changes • Unexpected Interest rate changes • Unexpected Share value changes In all cases the changes are unexpected!
Techniques for Managing Risk • On-balance-sheet transactionsloans, bonds, stocks and deposits. • Forecasting • Diversificationholding many non-correlated instruments. • Hedging with derivatives
Hedging with derivatives Call option = C(S, K, T, r, s) Models Put option = P(S, K, T, r, s) Binomial or Black-Scholes Hedge parameters:
Formal Analysis -1 = number of units of the derivative product x = number of units of the underlying S = today´s stock price T = today’s time to mature Value of the portfolio: A delta hedge is characterized by: The delta hedge must be rebalanced over time.
Formal Analysis n = number of units of the derivative product n m = number of units of the derivative product m x = number of units of the underlying S = today´s stock price T = today’s time Value of the portfolio: A delta gamma hedge is characterized by: Gives n and m with known x.
VaR: Value at Risk • Portfolio measure of risk • Potential loss in a portfolio over a specified period of time • Based on history volatility correlation Gains Losses change in value
Three Key Questions Exposure What risk? How much? Volatility & Correlation How much could prices change? How much can I lose? Sensitivity How much will P&L change per unit?¨
What is VaR • VaR is the maximum loss a portfolio can incur over aspecified time period, with a specified probability. • VaR is a vital component of current “best” practices inrisk measurement • VaR is used by practitioners and academics • VaR is valuable as a probabilistic measure of potentiallosses
What VaR is NOT • VaR is NOT the worst case scenario • VaR does NOT measure losses under any particular market condition • VaR -- by itself -- is NOT sufficient for riskmeasurement
Typical Uses of VaR • Translate portfolio exposures into potential P&L • Aggregate and reports multi-product, multi-marketexposure into one number • Uses risk factors and correlations to create a riskweighted index e.g. what is my equivalent risk position
How VaR is calculated • Sensitivity Estimate Model -- use sensitivity factors such as duration to estimate the change in value of the portfolio to changes in market rates and prices. • Full Revaluation Models -- use pricing algorithms such as bond formulae or option pricing models to estimate the the change in value of the portfolio to changes in market rates and prices.
Why is the VaR Different? • The sensitivity VaR assumed that the bond’s value would change by some basis point. • But, as interest rates changes, bond price become more sensitive to changes in interest rates. • The change in sensitivity at different interest rate levels is nonlinear.
Sensitivity Models Fast Don’t require model library Easy to understand Implemented in less time Revaluation models Gives more accurate P&L results Are price-based Can handle complex products VaR Sensitivity vs. Revaluation
VaR Inputs • Position Size -- the size of the instruments in the portfolio • Price/Yield Volatility -- The magnitude of the underlying prices and yield changes • Price/Yield Correlation -- Degree to which price and yield changes move together • VaR Estimation Period -- The time over which P/L in estimated • Confidence Level -- The frequency which actual losses
Monte Carlo Simulation Monte Carlo is most helpful when some or all asserts in a portfolio are not amenable to analytical treatment • Scenario Generation -- produce a large number offuture price scenarios • Portfolio valuation -- for each scenario, compute aportfolio value • Summary -- report the result of the simulation, eitheras a portfolio distribution or as a risk measure