Download
1 / 1
10 likes | 115 Vues
Investigating the correlation between MMSE and SIB scores in moderate Alzheimer's disease patients over 24 weeks.

E N D
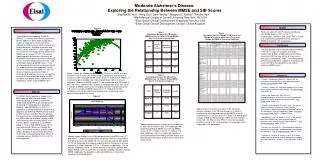
Visit Number of Patients Correlation Coefficient p-value Week 12 64 0.44047 0.0003 Week 24 66 0.60705 <.0001 Endpoint 73 0.60183 <.0001 Visit Number of Patients Correlation Coefficient p-value Week 12 0.3226 0.0037 79 81 Week 24 0.3762 0.0009 Endpoint 0.3957 0.0003 75 Moderate Alzheimer’s Disease: Exploring the Relationship Between MMSE and SIB Scores • Stephen W. Hurt1, Heng Zou2, Jane Yardley3, Margaret L. Moline2, Timothy Hsu2 • 1Weill Medical College of Cornell University, New York, NY, USA • 2Eisai Global Clinical Development, Ridgefield Park, NJ, USA • 3Eisai Global Clinical Development, London, United Kingdom Results For the 24-week ITT LOCF analysis of probands with MMSE scores of 12-14 or 15-17 at randomization, change in SIB scores were 1.79 and 2.22 respectively compared to mean changes in MMSE of 2.03 and 1.97 respectively. Conclusions The SIB retained a linear relationship to the MMSE in the 15-17 range and a pattern of change relationships to other symptomatic and functional measures of AD that was similar to those seen in other parts of the MMSE range. These data provide preliminary psychometric support for expanding the use of the SIB to include patients with higher moderate MMSE scores. Figure 1 Introduction Since originally developed by Saxton & Swihart,[1],[2]versions of the Severe Impairment Battery (SIB) have been widely employed in studies of moderate to severe dementia. Although the SIB has been administered in less severe dementias, including in patients with MMSE scores up to 20[3],[4], some suggest that the instrument is limited by ceiling effects when MMSE scores exceed 10-14.[5] The current typical cognitive assessment instrument for moderately severe dementia remains the ADAS and its variations despite criticism of this scale at the lower moderate MMSE range.[6] Thus, when designing clinical trials encompassing the full range of patients with moderately severe dementia (conventionally MMSE 10 - 20), the choice of cognitive assessment tools is challenging. To address this issue, we report an analysis of the relationships among the SIB and other instruments across a portion of the moderate to severe range of MMSE (5-17). Table 1 Correlations Between the SIB and the MMSE by Visit, for Patients Whose MMSE Was 12-14 at the Screening Visit Table 3 Correlation Between Change in SIB Scores and Change in Scores for Measures of Functional Change, by MMSE at Screening (Low/High) Figure 1shows the relationship between the SIB and the MMSE at end of treatment (LOCF) across the MSAD study. Endpoint was chosen for this analysis in order to include MMSE scores above 17; patients with MMSE >17 at screening were ineligible, but some attained these higher scores on treatment. Across the MMSE range 5-17, the relationship with SIB (range 2-99) is not linear. However, the variability in the dispersion of the SIB scores in relation to MMSE scores of 12-14 roughly matches the dispersion of the SIB scores in relation to MMSE scores of 15-17. Note that the 95% confidence limits for the logarithmic function of the relationship remain consistent throughout this range. Table 2 Correlations Between the SIB and the MMSE by Visit, for Patients Whose MMSE Was 15-17 at the Screening Visit References [1] Saxton J, McGonigle-Gibson JL, Swihart AA. An assessment device for the severely demented patient. J Exp Clin Neuropsychol. 1988; 10:62. [2] Saxton J, Swihart AA. Neuropsychological assessment of the severely impaired elderly patient. Clin Geriatr Med. 1989; 5:531-43. [3]Peavy GM, Salmon DP, Rice VA, et al. Neuropsychological assessment of severely demented elderly: the severe cognitive impairment profile. Arch Neurol. 1996; 53:367-72. [4] Schmitt FA, Ashford W, Ernesto C, et al. The severe impairment battery: concurrent validity and the assessment of longitudinal change in Alzheimer's disease. The Alzheimer's Disease Cooperative Study. Alzheimer Dis Assoc Disord. 1997;11 (Suppl 2):S51-6. [5] Barbarotto R, Cerri M, Acerbi C, et al. Is SIB or BNP better than MMSE in discriminating the cognitive performance of severely impaired elderly patients? Arch Clin Neuropsychol. 2000; 15:21-9. [6] Wesnes KA, Harrison JE. The evaluation of cognitive function in the dementias: methodological and regulatory considerations. Dial Clin Neuroscience. 2003; 5: 77-88. [7]Feldman H, Gauthier S, Hecker J, et al. A 24-week, randomized, double-blind study of donepezil in moderate to severe Alzheimer's disease. Neurology. 2001; 57:613-20. Methods The MSAD Study reported on subjects with both moderate and severe dementia.[7] The study design was a 24-week, multicenter, randomized, double-blind, parallel-group trial comparing 10 mg donepezil vs. placebo. Eligibility required MMSE 5-17, FAST < 7, probable or possible Alzheimer’s disease (AD) diagnosis per NINCDS/ARDRA criteria and CT or MRI consistent with AD. For this abstract, the linearity of the relationship between MMSE and SIB and the correlation of change in SIB scores from baseline to various points in the trial for subjects assigned to a Low MMSE group (1-14) or a High MMSE group (15-17) were determined. Measures included the CIBIC, Instrumental Activities of Daily Living (IADL), Disability Assessment for Dementia (DAD) and Functional Rating Scale (FRS). A subgroup analysis (MMSEs 12-14 vs 15-17) was conducted. Figure 2 Table 3shows the results of analysis of the correlation between changes in the SIB and changes in functional measures for two subgroups defined by MMSE score at screening visit: 12-14 (low) and 15-17 (high). For both groups, changes in SIB correlated with the CIBIC and with changes in the IADL, the DAD and the FRS. Further, the correlation coefficients were in the same direction and of broadly similar magnitude in the two groups. Tables 1 and 2present the results of further analyses of data from the MSAD study. Two subgroups were defined according to MMSE at screening: MMSE scores of 12-14 (Table 1) and 15-17 (Table 2). For both subgroups, there is a statistically significant correlation between the MMSE and SIB scores at all post-baseline time-points at which these scales were administered. Figure 2shows changes in the SIB from baseline in the MSAD study (ITT population). Comparing the donepezil subgroups, while the magnitude of change for patients with MMSE 15-17 is less than for patients with MMSE 12-14, the magnitude of change at endpoint (EOS in the figure) is virtually identical in the two subgroups (1.77 vs. 1.82 points, respectively). For the placebo subgroups, there is a smaller decline in the SIB for patients with higher MMSE scores at screening, as might be expected. However, for both MMSE subgroups, the placebo vs. donepezil difference is statistically significant favoring donepezil.