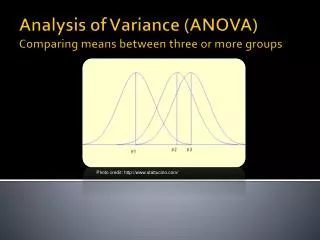
Between-Groups ANOVA
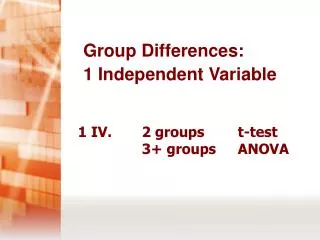
Between-Groups ANOVA. Chapter 12. When to use an F distribution Working with more than two samples ANOVA Used with two or more nominal independent variables and an interval dependent variable. Why not use multiple t -tests?. The problem of too many t tests Fishing for a finding


Between-Groups ANOVA
E N D
Presentation Transcript
Between-Groups ANOVA Chapter 12
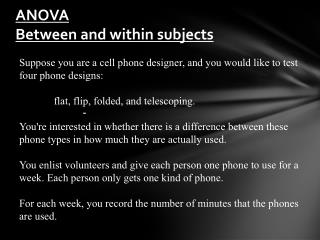
When to use an F distribution • Working with more than two samples • ANOVA • Used with two or more nominal independent variables and an interval dependent variable
Why not use multiple t-tests? • The problem of too many t tests • Fishing for a finding • Problem of Type I error
The F Distribution • Analyzing variability to compare means • F = variance between groups variance within groups • That is, the difference among the sample means divided by the average of the sample variances
Types of Variance • Between groups: estimate of the population variance based on differences among group means • Within groups: estimate of population variance based on differences within (3 or more) sample distributions
Check Your Learning • If between-groups variance is 8 and within-groups variance is 2, what would F be?
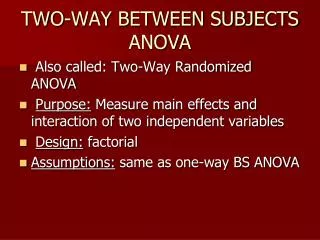
Types of ANOVA One-Way: hypothesis test including one nominal variable with more than two levels and a scale DV Within-Groups: more than two samples, with the same participants; also called repeated-measures Between-Groups: more than two samples, with different participants in each sample
Assumptions of ANOVAs Random selection of samples Normally distributed sample Homoscedasticity: samples come from populations with the same variance
One-Way Between-Groups ANOVA • Everything about ANOVA but the calculations • 1. Identify the populations, distribution, and assumptions. • 2. State the null and research hypotheses. • 3. Determine the characteristics of the comparison distribution. • 4. Determine the critical value, or cutoff. • 5. Calculate the test statistic. • 6. Make a decision.
Step 3. Characteristics • What are the degrees of freedom? • If there are three levels of the independent variable? • If there are a total of 20 participants in each of the three levels?
Logic behind the F Statistic • Quantifies overlap • Two ways to estimate population variance • Between-groups variability • Within-groups variability
The Source Table • Presents important calculations and final results in a consistent, easy-to-read format
Bringing it All Together • What is the ANOVA telling us to do about the null hypothesis? • Do we reject or accept the null hypothesis?
An F Distribution Here the F statistic is 8.27 while the cutoff is 3.86. Do we reject the null hypothesis?
Making a Decision Step 1. Compare the variance (MS) by diving the sum squares by the degrees of freedom. Step 2. Divide the between-groups MS by the within-groups MS value. Step 3. Compare the calculated F to the critical F (in Appendix B). If calculated is bigger than critical, we have a significant difference between means
Calculating Effect Size R2 is a common measure of effect size for ANOVAs.
Post-Hoc Tests to Determine Which Groups Are Different • When you have three groups, and F is significant, how do you know where the difference(s) are? • Tukey HSD • Bonferonni • A priori (planned) comparisons
Tukey HSD Test • Widely used post hoc test that uses means and standard error
The Bonferroni Test • A post-hoc test that provides a more strict critical value for every comparison of means. • We use a smaller critical region to make it more difficult to reject the null hypothesis. • Determine the number of comparisons we plan to make. • Divide the p level by the number of comparisons.