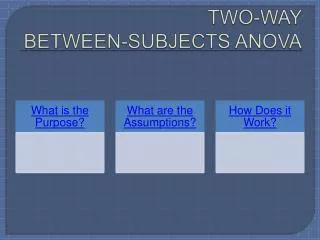
TWO-WAY BETWEEN SUBJECTS ANOVA
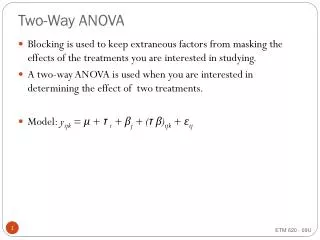
TWO-WAY BETWEEN SUBJECTS ANOVA. Also called: Two-Way Randomized ANOVA Purpose: Measure main effects and interaction of two independent variables Design: factorial Assumptions: same as one-way BS ANOVA. Dividing the Variance. Total = A + B + AxB + Within Groups

TWO-WAY BETWEEN SUBJECTS ANOVA
E N D
Presentation Transcript
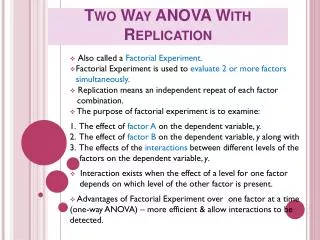
TWO-WAY BETWEEN SUBJECTS ANOVA • Also called: Two-Way Randomized ANOVA • Purpose: Measure main effects and interaction of two independent variables • Design: factorial • Assumptions: same as one-way BS ANOVA
Dividing the Variance • Total = A + B + AxB + Within Groups • A: differences between levels of A • B: differences between levels of B • AxB: other between group differences • Within Groups: differences within groups
A Variance affected by: • effect of Factor A (systematic) • individual differences (non-systematic) • measurement error (non-systematic) • B Variance affected by: • effect of Factor B (systematic) • individual differences (non-systematic) • measurement error (non-systematic)
AxB Variance affected by: • AxB interaction (systematic) • individual differences (non-systematic) • measurement error (non-systematic) • Within Groups variance affected by: • individual differences (non-systematic) • measurement error (non-systematic)
ANOVA Summary Table Source SS df MS F p Factor A Factor B AxB Within Total
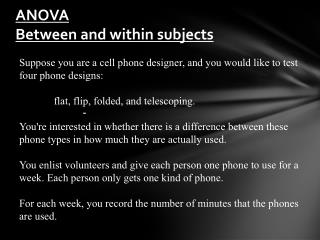
Computation of Two-Way BS ANOVA EXAMPLE: An oral or written spelling test was given in one of three noise levels. Determine whether there were significant effects of test type, noise level, and the interaction of test type with noise level. (See data on next page)
Noise Level No Low High oral 15 15 12 Test 17 19 10 written 18 14 10 14 12 12
Means Noise Level No Low High oral 16 17 11 14.67 Test written 16 13 11 13.33 16 15 11 Overall mean = 14
ANOVA Summary Table Source SS df MS F p Test Type Noise Level Test x Noise Within Total
STEP 1: SS Between = S(xc-x)2 condition mean xc xc-x (xc-x)2 16 2 4 16 2 4 17 3 9 17 3 9 11 -3 9 11 -3 9 16 2 4 16 2 4 13 -1 1 13 -1 1 11 -3 9 11 -3 9 SS Between = 72
STEP 2: SS A = S(xa-x)2 (A is Test Type) mean for level of A xa xa-x (xa-x)2 14.67 .67 .45 14.67 .67 .45 14.67 .67 .45 14.67 .67 .45 14.67 .67 .45 14.67 .67 .45 13.33 -.67 .45 13.33 -.67 .45 13.33 -.67 .45 13.33 -.67 .45 13.33 -.67 .45 13.33 -.67 .45 SS Test Type = 5.40
STEP 3: SS B = S(xb-x)2 (B is Noise Level) mean for level of B xb xb-x (xb-x)2 16 2 4 16 2 4 16 2 4 16 2 4 15 1 1 15 1 1 15 1 1 15 1 1 11 -3 9 11 -3 9 11 -3 9 11 -3 9 SS Noise Level = 56
STEP 4: SS AxB = SS Between - SS A - SS B SS Test Type x Noise Level = 72 - 5.40 - 56 = 10.60
STEP 5: SS Within = S(x- xc)2 x x-xc (x-xc)2 15 -1 1 17 1 1 18 2 4 14 -2 4 15 -2 4 19 2 4 14 1 1 12 -1 1 12 1 1 10 -1 1 10 -1 1 12 1 1 SS Within = 24
ANOVA Summary Table Source SS df MS F p Test Type 5.40 Noise Level 56.00 Test x Noise 10.60 Within 24.00 Total 96.00
STEP 6: Calculate degrees of freedom. df A = a-1 a= # levels of A df Test Type = 2-1 = 1 df B = b-1 b= # levels of B df Noise Level = 3-1 = 2 df AxB = (a-1)(b-1) df Test x Noise = (1)(2) = 2 df Within = (a)(b)(n-1) n = # per group df Within = (2)(3)(1) = 6
ANOVA Summary Table Source SS df MS F p Test Type 5.40 1 Noise Level 56.00 2 Test x Noise 10.60 2 Within 24.00 6 Total 96.00 11
STEP 7: Calculate Mean Squares. MS Test Type = 5.40/1 = 5.40 MS Noise Level = 56/2 = 28.00 MS Test x Noise = 10.60/2 = 5.30 MS Within = 24/6 = 4.00
ANOVA Summary Table Source SS df MS F p Test Type 5.40 1 5.40 Noise Level 56.00 2 28.00 Test x Noise 10.60 2 5.30 Within 24.00 6 4.00 Total 96.00 11
STEP 8: Calculate F-ratios. F(Test Type) = 5.40 /4.00 = 1.35 F(Noise Level) = 28/4.00 = 7.00 F(Test x Noise) = 5.30/4.00 = 1.32
STEP 9: Look up critical values of F. Test Type F-crit (1,6) = 5.99 Noise Level F-crit (2,6) = 5.14 Test x Noise F-crit (2,6) = 5.14
STEP 10: Compare F to F-crit. If F is equal to or greater than F-crit, reject the Null Hypothesis. Test Type 1.35 < 5.99 Not sig. Noise Level 7.00 > 5.14 Sig. Test x Noise 1.32 < 5.14 Not sig.
ANOVA Summary Table Source SS df MS F p Test Type 5.40 1 5.40 1.35 >.05 Noise Level 56.00 2 28.00 7.00 <.05 Test x Noise 10.60 2 5.30 1.32 >.05 Within 24.00 6 4.00 Total 96.00 11
APA Format Sentence A Two-Way Between Subjects ANOVA showed a significant main effect of Noise Level, F (2,6) = 7.00, p < .05, a nonsignificant main effect of Test Type, F (1,6) = 5.40, p > .05, and a nonsignificant interaction, F (2,6) = 1.32, p > .05.
Computing Effect Size Compute 2 for each effect