Analyzing Two-Way ANOVA with Crossed and Nested Effects: Effects of Phosphor and Glass Types
This problem overview illustrates the application of Two-Way ANOVA in analyzing the interaction between two main effects: Phosphor Type and Glass Type. The main effects are crossed, allowing for interaction checks. Experimental units are nested within the combinations of these types, with a balanced design featuring three observations per cell. The analysis includes interaction plots and significant results indicated by specific F-ratios and p-values. Key attention is given to measures such as Tukey HSD and normality tests to validate the results.


Analyzing Two-Way ANOVA with Crossed and Nested Effects: Effects of Phosphor and Glass Types
E N D
Presentation Transcript
Two-way ANOVA problems Fixed effects analysis in a Two–way ANOVA
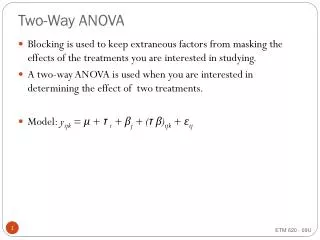
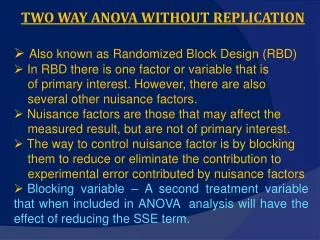
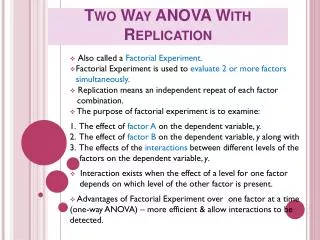
Crossing and Nesting, Balanced • Phosphor Type and Glass Type (the main effects) are crossed • For example, Phosphor Type 1 means the same thing regardless of Glass Type • Since main effects are crossed we can check for interaction • Experimental units are nested within combinations of Phosphor Type and Glass Type • Experimental unit 1 for one combination of Phosphor Type and Glass Type does not mean the same thing as Experimental unit 1 for a different combination of Phosphor Type and Glass Type • Since there are three observations for each cell the design is balanced
Problem 5.6 ANOVA Effect Tests Source DF Sum of Squares F Ratio Prob> F Phos. Type 2 933.33 8.8421 0.0044* Glass Type 1 14450.0 273.78 <.0001* Phos. Type*Glass Type 2 133.333 1.2632 0.3178
Tukey HSD Level Least Sq Mean 2 A 273.33333 1 B 260.00000 3 B 256.66667 Levels not connected by same letter are significantly different.
Crossed and Nested • Temperature and Glass are crossed • Can check for Interaction • Experimental units are Nested within Treatment combinations • There are three observations per cell so the design is balanced
Problem 5.10 Source DF Sum of Squares F Ratio Prob> F Glass Type 2 150864.5 206.3706 <.0001* Temp. 2 1970334.5 2695.259 <.0001* Glass *Temp. 4 290551.7 198.7257 <.0001* Error 18 2418330.1
LS Means Table (usually put in appendix) Level Least Sq Mean Std Error 1, 100 572.6667 11.038093 1, 125 1087.3333 11.038093 1, 150 1386.0000 11.038093 2, 100 553.0000 11.038093 2, 125 1035.0000 11.038093 2, 150 1313.0000 11.038093 3, 100 573.3333 11.038093 3, 125 1054.6667 11.038093 3, 150 886.6667 11.038093
Now this is slick… Level Least Sq Mean 1, 150 A 1386.0000 2, 150 B 1313.0000 1, 125 C 1087.3333 3, 125 C 1054.6667 2, 125 C 1035.0000 3, 150 D 886.6667 3, 100 E 573.3333 1, 100 E 572.6667 2, 100 E 553.0000 Levels not connected by same letter are significantly different.
Normality test Shapiro-Wilk W Test WProb<W 0.966954 0.5237 Note: Ho = The data is from the Normal distribution. Small p-values reject Ho.