Two-Way ANOVA
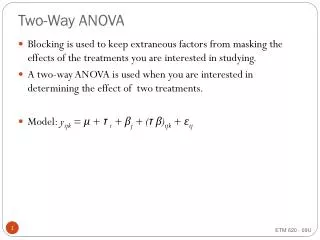
Two-Way ANOVA. Blocking is used to keep extraneous factors from masking the effects of the treatments you are interested in studying. A two-way ANOVA is used when you are interested in determining the effect of two treatments. Model: y ijk = μ + τ i + β j + ( τ β ) ijk + ε ij.

Two-Way ANOVA
E N D
Presentation Transcript
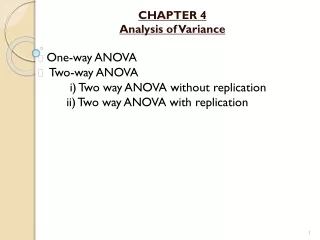
Two-Way ANOVA • Blocking is used to keep extraneous factors from masking the effects of the treatments you are interested in studying. • A two-way ANOVA is used when you are interested in determining the effect of two treatments. • Model: yijk = μ + τi + βj + (τ β)ijk + εij
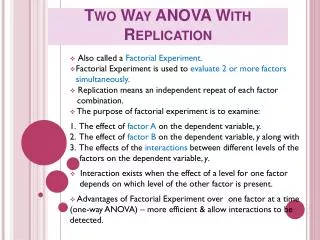
Two-Way ANOVA w/ Replication • You have been called in as a consultant to help the Pratt and Whitney plant in Columbus determine the best method of applying the reflective stripe that is used to guide the Automated Guided Vehicles (AGVs) along their path. There are two ways of applying the stripe (paint and coated adhesive tape) and three types of flooring (linoleum and two types of concrete) in the facilities using the AGVs. You have set up two identical “test tracks” on each type of flooring and applied the stripe using the two methods under study. You run 3 replications in random order and count the number of tracking errors per 1000 ft of track. The results are as follows:
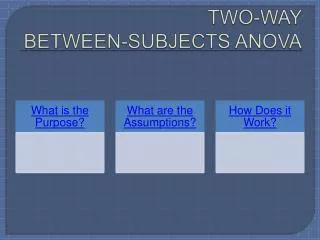
Two-Way ANOVA Example • Analysis is the same as with blocking, except we are now concerned with interaction effects
Your Turn • Complete the ANOVA in Minitab and fill in the blanks … • What does this mean?
What about interaction effects? • For example, suppose a new test was run using different types of paint and adhesive, with the following results:
Understanding interaction effects • Graphical methods: • graph means vs factors • identify where the effect will change the result for one factor based on the value of the other.
General factorial experiments (> 3 factors) • Example: 3-factor experiment. The model is: • Use Minitab: • Balanced ANOVA (if the experiment is balianced, i.e.,equal number of observations at each treatment combination.) • General Linear Model (GLM) if the experiment is unbalanced. • Allows for random effects and mixed models.
An example • Comparison of head-up and head-down displays • Manual flying mode • 2 display formats • 3 levels of ceiling & visibility – 5000 ft and 10 miles, 200 ft and ½ statute mile, and 0 ft and 1200 ft runway visual range • 2 levels of wind direction and velocity – 090 degrees at 10 knots and 135 degrees at 21 knots • Use Balanced ANOVA with visibility and wind as random effects. • “Model” is input as follows: Display| Wind| Visibility • To discuss – use “restricted” form of the model or not?
Minitab Output … • Using balanced ANOVA and restricted model.
2k factorials • Factorial experiments with multiple factors in which each factor can have several levels can get expensive in terms of number of trials required, especially if replication is desired. • If we choose not to replicate the experiment (i.e., only 1 observation per combination of factor levels), we lose the ability to evaluate higher level interactions. • Can get more “bang for the buck” with careful selection of two levels of each factor … i.e., a 2k factorial design.
Example: 22 factorial • Look at the effect of oven temperature and reaction time on the yield (in percent) of a process … Oven Temp.Reaction Time 110° 50 min. 130° 70 min. Take 2 observations at each combination with the following result:
To determine the effect of Temperature, we find the midpoint between the average “high” temp yield and the average “low” temp yield, or • Similarly, the effect of Time is … • And the interaction effect is …