Download

1 / 28
280 likes | 341 Vues
Market Trends for Natural Gas SPE Unconventional, June 15, 2011. When we think about the world of energy… …do we understand the present?. Our energy present is a function of our demographic and economic past Fundamental shifts are taking place

E N D
Market Trends for Natural GasSPE Unconventional, June 15, 2011
When we think about the world of energy……do we understand the present? • Our energy present is a function of our demographic and economic past • Fundamental shifts are taking place • For the foreseeable future, oil will remain critical to US and global energy supply • Natural gas will continue to gain market share contingent on development of internal markets and global trade • New fuels and/or fuel technologies could increase in importance • Pace depends on cost and timing; incumbent infrastructure is dominant – the challenge of energy density • Materials and nonfuel minerals may be more important • We deal in political rather than economic trade offs • Much of what we perceive in energy, economy, environment is a function of beliefs rather than evidence; perception is reality
Oil Price Bounds Down? Up? Global recovery will stimulate demand, especially in “BRICs” Belief governments will not alter product subsidies Noncommercial demand for commodity derivatives U.S. macro policy and the dollar • At the global level, clear intent from OPEC to sustain worldwide economic recover • Iraq and OPEC quotas; China • U.S. production turnaround? • Access, technology gains • Impact of climate policies and inter-fuel competition USEIA (left); IEA
NG Price Bounds Down? Up? Worldwide economic recovery, demand growth, “dash to gas” “no regrets” policy on climate Production growth slows LNG demand prevents peak shaving effects • Sustained success with shales and other plays • LNG shaves peaks • Access, technology gains • Inter-fuel competition displaces gas USEIA (left); IEA
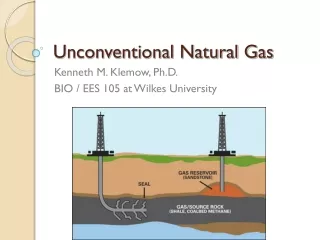
How Does Unconventional Gas Fit In? The Story… …and the “Back Story” Unknown unknowns in technology Shifting upstream business models Impact of oil directed drilling Is natural gas price volatility “dead”? Private lands event driven by historical price marker • “It’s a factory business…” • “Have I got a shale deal to sell you…” • “We can make money at $4…”
How Does Unconventional Gas Fit In? The Story… …and the “Back Story” Unknown unknowns in technology Shifting upstream business models Impact of oil directed drilling Is natural gas price volatility “dead”? Private lands event driven by historical price marker • “It’s a factory business…” • “Have I got a shale deal to sell you…” • “We can make money at $4…”
How Does Unconventional Gas Fit In? The Story… …and the “Back Story” Unknown unknowns in technology Shifting upstream business models Impact of oil directed drilling Is natural gas price volatility “dead”? Private lands event driven by historical price marker • “It’s a factory business…” • “Have I got a shale deal to sell you…” • “We can make money at $4…”
2010: “The 2003 NPC Study Was Prescient…” “[U.S. LNG market potential] is much more limited than typically realized… There is plenty of room for new spikes in Henry Hub price. But what about the possibility of a Henry Hub basis collapse? This could come about in two ways. One is the formation of a new gas bubble if new domestic [unconventional] supplies are more rapidly proved up than demand warrants. A second possibility exists with LNG.” -Michot Foss, OIES NG 18, Feb 07
“Glubbausage”! Searching for the bottom… CEE based on U.S. EIA
What drives oil and gas prices?An Experiment With FD Cost • Marginal barrel, MCF sets price • We can estimate price using “3x rule” • “If you want to make any money in this business, you need to sell oil for 3x your drilling costs: 1/3 for the well, 1/3 for the tax collector, and 1/3 for yourself.” (DB Commodities Research, 16 July 2007) • For oil, strong, sustained correlation between full, BE FD cost and market price • Implications for natural gas • FD cost, price interactions are persistent
Guitar, Man“Peak Oil” Explained! Unknown source; posted on “The Oil Drum”
Cost reductions are real… …but gainers, losers Impact of “Wall Street” technology
Break Even Gas PriceTop 30% Wells With Land Cost Used with permission
“Currently, the relationship between costs and prices is unfavorable for dry gas wells. Assuming a Henry Hub price of $5/MMBTU and a negative gas price differential of 30¢/MMBTU, the available margin for the base case dry gas well is only $1.80/MCF. In the majority of the jurisdictions in North America most of this margin is used to pay royalties (often $1/MCF or more), severance taxes, property taxes, and corporate tax.” Kepes, et al, OGJ 4/4/11, Fiscal Regimes
Living with negative margins… “In the past few years, a glut of natural gas has driven down the price to half the 2008 average—a level where it costs a U.S. consumer $2.75 a day to meet a home's natural-gas needs, according to the American Gas Association. That's good news for consumers, but a recent study by consultancy Wood Mackenzie found that 40% of U.S. natural gas produced last year didn't meet break-even prices for producers.” - Daniel Gilbert, WSJ, May 23, 2011
…means shifting strategies “Canadian and U.S. natural gas producers are responding to the U.S. oversupply by shifting away from drilling activity that focuses solely on natural gas. Instead, companies are targeting oil and natural gas containing…NGLs…to capitalize on the rise in oil prices.” NEB-Canada May 2011
Price Change & Volatility Matter What are the demand side drivers? Relatively small changes in supply, demand swing price Compiled by CEE using EIA
ERCOT Peak Day by Fuel Type Electric Reliability Council of Texas (ERCOT)
Does Renewable Energy Create Volatility? April 26, 2009 • Negative price intervals (15 min) • 76 • 338 • 4,894 • 3,069 • 4,445 (Nov) Compiled by CEE using ERCOT data
Note – precedes Germany announcement Bros/SG, used with permission, May 30, 2011
Environment Discontents • “Cleanest burning fossil fuel” • Hydraulic fracturing • Water use, disposal, contamination (chemicals and methane) • Seismicity • Air emissions • Drilling operations • Fugitive methane • Fugitive emissions from value chain • Is natural gas just too cheap?