Download
1 / 81
830 likes | 1.07k Vues
Evaluation of Macroeconomic Developments in Turkey with special focus on the real exchange rate misalignment Aykut Kibritçioğlu Associate Professor of Economics Ankara University, Turkey Tel.: (+90-312) 319 77 20, ext. 340 Fax: (+90-312) 319 77 36 E-Mail: kibritci@p olitics .ankara.edu.tr

E N D
Evaluation of Macroeconomic Developments in Turkey with special focus on the real exchange rate misalignment Aykut Kibritçioğlu Associate Professor of Economics Ankara University, Turkey Tel.: (+90-312) 319 77 20, ext. 340 Fax: (+90-312) 319 77 36 E-Mail: kibritci@politics.ankara.edu.tr Homepage: http://dialup.ankara.edu.tr/~kibritci/wiiw.html Vienna, November 11, 2004 Kibritçioğlu, November 8, 2004, (1/81)
The 1980-1989 Transformation 1978 - 1980: Balance-of-payments crisis, productivity slowdown and accelerating inflation January 1980: Announcement of a substantial stabilization and structural adjustment program in order to gradually liberalize the economy 1980 - 1982: Domestic financial liberalization May 1981: Abandonment of the fixed exchange-rate regime June 1984 - August 1989: Capital account liberalization and convertibility of the Turkish lira Post-1989 Macroeconomic Developments December 1993 - April 1994: A major currency crisis and acceleration in the inflation August 1999: Negative macroeconomic impacts of the Marmara earthquake December 1999: Announcement of an exchange-rate-based stabilization program for 2000-2002 November 2000 & February 2001: Two successive banking and currency crises and political instability in Turkey May 2001: Announcement of the new economic program Kibritçioğlu, November 8, 2004, (2/81)
“Turkey suffers from severe macroeconomic imbalances since late 1970s.” • MACROECONOMIC ENVIRONMENT • (1978 – 2001) • Political instability • Volatile economic growth • High and persistent inflation • Inflation-depreciation spiral • Strong “currency substitution” • Volatile short-term capital flows • Large current account deficits • Fragile banking sector • Public sector deficits • External shocks (oil prices, etc.) • Moral hazard problems • REAL SECTOR, • BANKING & • CURRENCY • CRISES • January 1980 • 1982-1985 • Early 1994 • November 2000 – February 2001 Causes? Effects? Dynamic Interactions? Kibritçioğlu, November 8, 2004, (3/81)
Research Visit to the WIIW (Vienna, Austria, November 1-15, 2004) • “An Analysis of Early Warning Signals of Currency Crises in Turkey, 1986-2004” • “Real Exchange Rate Misalignment in Turkey, 1987-2003” • “An Overview of Macroeconomic Developments in Turkey” • (with special reference to the AK-Party Era, 2002-04) • http://dialup.ankara.edu.tr/~kibritci/wiiw.html Kibritçioğlu, November 8, 2004, (4/81)
Signals Approach for Turkey Particularly the following signals are the most important early warning signals of currency crises that may occur within coming 12 months: • a falling ratio of exports to imports below 56 percent • a sharp worsening in order-expectations of Turkish exporters • a significant (more than 6.8, 5.8 or 5.1 percent) real appreciation of the Turkish lira against foreign currencies • a real interest rate differential more than –5.1 percent • an annual increase in crude-oil prices which is higher than 55.6 percent • a sharp fall in ISE’s National 100 index that exceeds 17.5 percent per month Kibritçioğlu, November 8, 2004, (5/81)
Real Exchange Rate Misalignment in Turkey, 1987-2003 • Policy makers and many researchers are interested in predicting and monitoring misalignment (M) in the foreign exchange market, because, in many cases, it is closely related to possible current account problems or impending currency crises. • M = ? Definition? Kibritçioğlu, November 8, 2004, (6/81)
Real Exchange Rate Misalignment in Turkey, 1987-2003 • Real exchange rate misalignment (M) measures deviations of actual real exchange rate (A) from its long-run, or equilibrium, level (E): M = (A – E) / E M > 0 => TL is depreciated in real terms M = 0 => A is a “realistic” exchange rate M < 0 => TL is appreciated in real terms Attention:A is an “observable” variable, while E is a “non-observable” one! Kibritçioğlu, November 8, 2004, (7/81)
Real Exchange Rates: Conceptual Classification E A E3 & E4 A1 & A2 E1 E2 Kibritçioğlu, November 8, 2004, (8/81)
Real Exchange Rate Misalignment in Turkey, 1987-2003 • This study mainly aims to discuss the sensitivity of estimation results to the alternative combinations of actual real exchange rate indices (A) and equilibrium definitions (E), by using quarterly data from 1987 to 2003 for Turkish lira. • The 16 measures of misalignment employed in this study show that the differences between these alternative measures vary between 6.5 and 36.5 percent points, which actually is a very strong indication for high sensitivity of the degree of misalignment to the selected combination of the A and E values. Kibritçioğlu, November 8, 2004, (9/81)
Actual Real Exchange Rates (A): Alternatives 1995=100, 1995.I – 2003.III Kibritçioğlu, November 8, 2004, (10/81)
Actual Real Exchange Rates (A): Selected A’s 1995=100, 1987.I – 2003.III Kibritçioğlu, November 8, 2004, (11/81)
Actual Real Exchange Rates (A): Properties A1: Trade-Weighted Real Effective Real Exchange Rate 1995=100; for 8 countries; PTΣaeWPIf , PNCPId ; A1 = PT/PN .Source: SIS, CBRT and IMF’s IFS; authors’ calculations. A2: Internal (TNT) Real Exchange Rate Index 1995=100; derived by using implicit price deflators calculated from GDP accounts: PT (bPx+ g Pm) and PNPy-x+m ; A2 = PT / PN . Source: SIS and CBRT; authors’ calculations; deseasonalized. A3: Reuters’ TRTWIN Index June 1999 = 100; for four countries; trade-weighted. Source: Reuters; the inverse of the original index; base year adjusted as 1995=100. A4: SPO’s Real Effective Real Exchange Rate Index Jan. 1982 = 100; USD: 75% & Euro: 25%; for USA & Euro area PPI and for Turkey WPI. Source: SPO; the inverse of the original index; base year adjusted as 1995=100. Kibritçioğlu, November 8, 2004, (12/81)
Real Exchange Rate Misalignment (M) 16 Different Measures of Misalignment According to 4 Different Actual Real Exchange Rate Indices and 4 Different Equilibrium Definitions Kibritçioğlu, November 8, 2004, (13/81)
Degree of Differences between 16 M Measures Kibritçioğlu, November 8, 2004, (14/81)
The Relation between Misalignment and Currency Crises Degree of Real Appreciation of the Turkish lira prior to 1994 & 2001 Currency Crises (%) Negative signed figures above indicate the degree of real appreciation of the Turkish lira, while positive ones imply a real depreciation. That is, negative-signed figures show to what extentthe relevant A index is below its equilibrium level, and vice versa. Kibritçioğlu, November 8, 2004, (15/81)
Actual Real Exchange Rates (A): Monthly Data Kibritçioğlu, November 8, 2004, (16/81)
Real Exchange Rate Misalignment (M): Monthly Data Kibritçioğlu, November 8, 2004, (17/81)
Summary: As of fall 2004, the Turkish lira is slightly depreciated in real terms. No indication of a currency crisis! Kibritçioğlu, November 8, 2004, (18/81)
Recent Macroeconomic Developments in Turkey Kibritçioğlu, November 8, 2004, (19/81)
Governments & Political Instability in Turkey, 1969-2004 • 1969-2004 = 36 years = 432 months • Average period between two general elections = 48 months = 4 years • Average life of governments = 15.4 months = 1.3 years • (ICRG=International Country Risk Guide; a declining PR index indicates an increase in the political risk.) Kibritçioğlu, November 8, 2004, (20/81)
Summary: Turkey seems to have politically stabilized within the last two years. Kibritçioğlu, November 8, 2004, (21/81)
Market for Goods: Inflation & Disinflation Kibritçioğlu, November 8, 2004, (22/81)
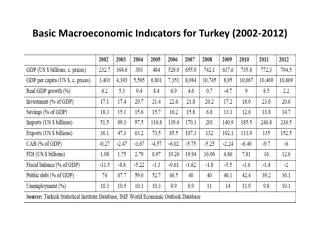
Turkey suffered from high and persistent inflation since more than three decades. But, finally, it’s declining now... Kibritçioğlu, November 8, 2004, (23/81)
Annual inflation rates fell below 15 percent as end of September 2004. (Official target for Dec. 2004: 12 percent) • Inflationary expectations in the country are also changing in a positive direction. Kibritçioğlu, November 8, 2004, (24/81)
Summary: The disinflation process is still ongoing... Kibritçioğlu, November 8, 2004, (25/81)
Market for Goods: Production & Productivity Kibritçioğlu, November 8, 2004, (26/81)
Indicators of Long-Run Growth in Turkey • Turkey’s economic growth performance was highly volatile since 1950. Kibritçioğlu, November 8, 2004, (27/81)
GDP per capita ($): Turkey & Selected Countries • In an international context, however, Turkey’s economic growth performance is relatively poor. Kibritçioğlu, November 8, 2004, (28/81)
In recent years, growth rate of the real GDP has significantly fluctuated. • The Turkish real sector is recovering from the 2000-2001 crisis, which is one of the four deepest economic crises after 1950. Kibritçioğlu, November 8, 2004, (29/81)
Industrial Production Index (1980=100) • Turkish industrial sector demonstrated a remarkable growth performance since 1980. Kibritçioğlu, November 8, 2004, (30/81)
Annual increases in the industrial production index sharply fluctuate around an average annual growth of 10 percent, during the AK-Party era. Kibritçioğlu, November 8, 2004, (31/81)
Capacity utilization ratio in manufacturing industry also increased up to the pre-crisis level in recent months. Kibritçioğlu, November 8, 2004, (32/81)
The manufactuing industry exhibits a remarkable increase in labor productivity. • The reasons for that are still not investigated by economists sufficiently. Kibritçioğlu, November 8, 2004, (33/81)
Summary: Volatile Production Growth, but Recovery from 2000-01 Crisis & High productivity growth & Agricultural sector (?) Kibritçioğlu, November 8, 2004, (34/81)
Labor Market: Employment & Real Wages Kibritçioğlu, November 8, 2004, (35/81)
The increases in manufacturing production are not fully accommodated by increases in employment. • Turkey has still to solve the unemployment problem that has been deepened after the 2000-2001 financial crisis. Kibritçioğlu, November 8, 2004, (36/81)
Real wages in manufacturing industry declined significantly following the 2000-2001 crisis. • They shrinked about 18 percent during the crisis. Kibritçioğlu, November 8, 2004, (37/81)
Summary: Increasing Productivity & High Unemployment & Low Real Wages Kibritçioğlu, November 8, 2004, (38/81)
Foreign Exchange Market: Exchange Rates, and Currency Substitution Kibritçioğlu, November 8, 2004, (39/81)
“Black-Market” Exchange Rates (BMER) vs. Official Exchange Rates (OER) and Annual Increases in OER (1950-2004) • Since May 1981, Turkey has a relatively flexible exchange rate system. This gradually removed the “black-market” for FX in Turkey. • In 2000, the monthly growth rates of nominal exchange rates were pre-determined to gradually disinflate the economy. Kibritçioğlu, November 8, 2004, (40/81)
Note that annual growth rate of nominal USD exchange rates turned to negative values between May 2003 and April 2004. Kibritçioğlu, November 8, 2004, (41/81)
Following the 2000-2001 crisis, gross FX reserves of the Turkish Central Bank increased significantly. • They are now about 38 percent higher than the level of reserves prior to the crisis. Kibritçioğlu, November 8, 2004, (42/81)
There is a tendency towards reverse currency substitution during the AK-Party era. • Government’s success in disinflating the economy and its increasing credibility may significantly be contributing to this process. Kibritçioğlu, November 8, 2004, (43/81)
Summary: Nominal exchange rate changes stabilized & High FX Reserves of the CB & CS is reversed Kibritçioğlu, November 8, 2004, (44/81)
Balance of Payments and External Debts Kibritçioğlu, November 8, 2004, (45/81)
History of Taxation in Turkish International Trade in Goods (1925-2002) Kennedy(1967) Customs Union with the EU (1996) Tokyo (1979) GATT (1947) Uruguay (1986-1993) • Foreign trade liberalization in Turkey is closely associated to Turkey’s relations to the GATT/WTO and the European Union (EU). Kibritçioğlu, November 8, 2004, (46/81)
Exports to Imports Ratio in Turkey (1950-2004, monthly) • The share of the agricultural products on exports decreased in Turkey, and the volatility of exports to imports ratio in Turkey declined since early 1980s. Kibritçioğlu, November 8, 2004, (47/81)
The developments in the exports to imports ratio show that foreign trade deficits are increasing since early 2002. Kibritçioğlu, November 8, 2004, (48/81)
Export and Import Price Indices (1982=100, monthly averages) Kibritçioğlu, November 8, 2004, (49/81)
Goods Composition of Turkish Exports and Imports (1969-2003, ISIC, percent) Exports Imports Kibritçioğlu, November 8, 2004, (50/81)