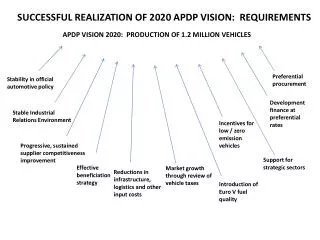
APDP Vision 2020 Can we do it?
APDP Vision 2020 Can we do it?. Dr Johan van Zyl President and CEO: Toyota SA Motors Managing Officer: Toyota Motor Corporation. Contents. Background The Motor Industry Global Relevance SA Contribution & importance The Motor Industry Vision (1.2m by 2020) Evaluation of Building blocks


APDP Vision 2020 Can we do it?
E N D
Presentation Transcript
APDP Vision 2020 Can we do it? Dr Johan van Zyl President and CEO: Toyota SA Motors Managing Officer: Toyota Motor Corporation
Contents • Background • The Motor Industry • Global Relevance • SA Contribution & importance • The Motor Industry Vision (1.2m by 2020) • Evaluation of Building blocks • Further improvements • Conclusion
1. Background: Roadmap Roadmap for Industry Vision 2011: Feedback & updated building blocks (1.2m target) 2008: 1 million target set 2013 – 2020 2006: Building blocks determined Automotive Production Development Plan (APDP) 1995 – 2012 Motor Industry Development Programme (MIDP) 1989 – 1994 Phase 6 Local Content Programme 1989 2000 2010 2020
1. Background: Roadmap Roadmap to achieving 1.2m & international competitiveness
2. Motor Industry: Global Relevance Vehicle Sales by Region Sales (million units) Change 2012 vs. 2011 (millon units) +3.9 Asia-Pacific Rest of World North America Asia-Pacific Central and Eastern Europe South America South America North America Central and East Europe Rest of World West Europe Western Europe Source: VDA, IHS Global Insight, Automobile Manufacturers Ass& Toyota estimate
2. Motor Industry: Global Relevance Vehicle Production by Region Structure in % Rest of World China Japan North America Western Europe Source: VDA, IHS Global Insight& Toyota calculation
2. Motor Industry: Global Relevance Most Important Production Countries Rank 2012 (2011) million units Cars CV SA 0.64% Ranked 25th Anmerkung: teilweise geschätzt Source: VDA, Polk Germany, press information, note: partly estimated, car production USA, Canada and Mexico = cars & LCV
2. Motor Industry: Global Relevance Jan-Mar 2013 World Passenger/LCV Market Growth/Decline: Market: +11,9% North America Western Europe Central and Eastern Europe Showing signs of recovery (Sept 2013) 5,6% -9,8% -4,4% South America Rest of the World Asia Pacific 4,5% 6,8% -1,5%
2. Motor Industry: Global Relevance SA Auto Production vs. Global Production
2. Motor Industry: Global Relevance Auto exports as % of total exports
2. Motor Industry: SA Contribution Automotive Sector Share of GDP
2. Motor Industry: SA Contribution Automotive Industry Employment Levels
2. Motor Industry: SA Contribution Contribution to balance of trade (2012) Actual 2012 Automotive trade balance if there was no local motor manufacturing industry (est.)
2. Motor Industry: SA Contribution Motor industry trade balance -49.2 -38.6 -30.7 -18.9 Source: AIEC
2. Motor Industry: SA Contribution Motor Industry contribution to total exports Source: NAAMSA
2. Motor Industry: SA Contribution Local content Source: NAAMSA
2. Motor Industry: SA Contribution MIDP key performance indicators: 1995 vs. 2012 Source: AIEC
2. Motor Industry: SA Contribution Automotive trade balance ratio Source: AIEC
3. Motor Industry Vision: Building Blocks Export Investment Cost Competitiveness Local Supplier Base Domestic Market growth/size Stable Political & Economic Policy Automotive Production Development Program 1.2m production by 2020 ? ? ? ?
3. Motor Industry Vision: Building Blocks Export Investment Cost Competitiveness Local Supplier Base Domestic Market growth/size Stable Political & Economic Policy Automotive Production Development Program 1.2m production by 2020
3. Road Map: Domestic Market Domestic market forecast for 2020 Vision Achievement SA motor market needs to grow by 6.7% compounded per annum.(Over last 10 years the motor market has outperformed the GDP growth at a rate of 7.3% vs. 3.4%) The ratio of CBU imports vs. locally manufactured vehicles needs to remain at 60% (Over last 10 years this ratio has increased from 30% to 61%) Source: NAAMSA
3. Building Blocks: Export Market Task for motor vehicle export for 2020 Vision Achievement SA motor vehicle export needs to grow by 190%. (Over last 10 years the motor market has grown by 152%) Vision 1,2 mil The percentage of CBU export to total manufacturing needs to grow to 67% (Over last 10 years this ratio has increased from 25% to 54%) Source: NAAMSA
3. Motor Industry Vision: Building Blocks Export Investment Cost Competitiveness Local Supplier Base Domestic Market growth/size Stable Political & Economic Policy Automotive Production Development Program 1.2m production by 2020 • Cost competitiveness • Local content • Labour
3. Building Blocks: Competitiveness Cost Competitiveness <Metal Pressings> Source: AIDC 11.25% 25%
3. Building Blocks: Competitiveness Cost Competitiveness <Iron Castings> Source: AIDC Internal & External Factors Impact 12.5% 32.66%
3. Building Blocks: Value Chain Localisation Image Excluding. engine & gearbox Imported Imported in Local Local
3. Building Blocks: Value Chain Current local content levels (average) XX%: % of total material cost material cost YY%: true local material plus value add as % of total Exterior 10% • Glass • Paint • Bumpers • Mirrors Electrical / Electronic • Harnesses • Starter motors • Alternators • Wiper systems • HVAC 3% 19% 5% Interior 23% • Cockpit • Seats • Door panels • Carpets Body 7% 15% • Bonnets • Bootlids • Sideframes • Doors 6% • Axles • Differentials • Drive shafts • Brakes Chassis and Drive-train 33% 14% Note: %’s indicative only
3. Building Blocks: Value Chain Challenges in expanding and deepening local content Electrical / Electronic Exterior • Low volumes / economies of scale • Frequently changing technology • Distance from design centres Interior • Differing raw materials specs (resins, carpets) • Differing technologies Body • Local steel quality • Local steel specifications • Investment costs • Differing OEM specifications • Local steel quality • Local steel specifications Chassis and Drive-train
3. Building Blocks: Value Chain Why are we not competitive? • Strong/ fluctuating currency • Logistics and localisation disadvantage • Our local contents and high V to V component content? • Our production volume? • Our productivity with high wage demands? • Mindset? • In my opinion it is a combination of factors
3. Roadmap: Competitiveness • <Counter Measures> • Logistics • New rail capacity for the SA industry (Transnet investment of R500m in automotive wagons to date & R300billion over the next 7 years) • Port costs reduction short term (R1bn rebate given to exporters) and long term (cargo dues reduction) • Port capacity improvement • Accelerated document management • Maximising coastal services between ports • Labour • Fundamental reform • Changes in collective bargainingprocess • Joint collaborative process between government, industry & labour to find sustainable solution to create labour stability and supply.
3. Roadmap: Value Chain • <Counter Measures> • Localisation • Supplier competiveness improvement • ASCCI announced by Min Davies at JIMS opening • Supply chain competitiveness improvement through increased production capacity, gainful employment and sector economic transformation • OEM purchasing council activities • OEM’s combining supplier volumes for greater economies of scale. • Introduction of new automotive technologies and growth in local content.
3. Roadmap: Value Chain • <Counter Measures> • Localisation • Beneficiation (from raw materials upstream) • Gov. initiative to restrict exports of scrap metals will assist with local beneficiation. • Gov. strategy for “Developmental” pricing on local raw materials is critical to achieving lower auto parts costs in SA. • Refocus on aluminium foundry competitiveness and new products • Automotive Administration System (AAS) by 5 OEM’s: • Ensuring that the APDP delivers local value addition (VA) • Tracking of local suppliers VA and local materials usage. • Unlocking of tier 2 and 3 VA. • Deepening of supply chain by increasing VA and material localisation.
4. Conclusion • To achieve 1.2m is a huge task and challenging vision. • Achievement is dependant on global and domestic GDP growth. • Need to grow export but also encourage importers to produce locally.