Download
1 / 1
10 likes | 153 Vues
AGU 12, IN53C-1756 - Field : a new meta-authoring platform for data-intensive scientific visualization http://openendedgroup.com/artworks/data- sets.html , https://github.com/OpenEndedGroup/ Field. Marc Downie , Paul Kaiser ( Open Ended Group)

E N D
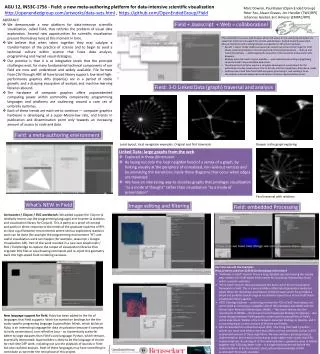
AGU 12, IN53C-1756 - Field: a new meta-authoring platform for data-intensive scientific visualization http://openendedgroup.com/artworks/data-sets.html , https://github.com/OpenEndedGroup/Field Marc Downie, Paul Kaiser (Open Ended Group) Peter Fox, Alvaro Graves, Jim Hendler (TWC/RPI) Johannes Goebel, Eric Ameres (EMPAC/RPI) • ABSTRACT: • We demonstrate a new platform for data-intensive scientific visualization, called Field, that rethinks the problem of visual data exploration. Several new opportunities for scientific visualization present themselves here at this moment in time. • We believe that when taken together they may catalyze a transformation of the practice of science and to begin to seed a technical culture within science that fuses data analysis, programming and myriad visual strategies. • Our premise is that it is at integrative levels that the principle challenges exist, for many fundamental technical components of our field are now well understood and widely available. File formats from CSV through HDF all have broad library support; low-level high-performance graphics APIs (OpenGL) are in a period of stable growth; and a dizzying ecosystem of analysis and machine learning libraries abound. • The hardware of computer graphics offers unprecedented computing power within commodity components; programming languages and platforms are coalescing around a core set of umbrella runtimes. • Each of these trends are each set to continue — computer graphics hardware is developing at a super-Moore-law rate, and trends in publication and dissemination point only towards an increasing amount of access to code and data. Field+ Javascript +Web = collaboration! • The embedded in-process web browser allows full access to the underlying document via Javascript. Field has full support for remote, web-browser- hosted Javascript execution. Mouse interaction and scrolling behaves as expected on all textured surfaces. • Benefit = speed. Unlike traditional Javascript environments the Online Plugin for Field allows Javascript programs to be executed and constructed piecemeal — built up and tuned interactively — while keeping the execution of the Javascript online and in web-browsers. • Multiple execution hosts may be available — each web-browser visiting a page being served by Field’s new embedded web server. • This allows the Field to be used as a complete development environment for the authorship of online visualizations that fit directly into the Linked Open Data demo model. • Field sources Linked Data from LOGD via Sparql, processing it, and sending it to an interactively authored Javascript visualization in Protovisrepresentation server. Field: 3-D Linked Data (graph) traversal and analysis Field: a meta-authoring environment Local-layout, local navigation examples: Original and first traversals Deeper in the graph exploring • Linked Data: large graphs from the web • Explored in three dimensions • By laying out only the local neighborhood of a vertex of a graph, by hinting visually at the periphery of unrealized, non-laid-out vertices and by animating the transitions inside these diagrams that occur when edges are traversed. • We have an interesting way to visualize graphs that privileges visualization “as a mode of thought” rather than visualization “as a mode of presentation”. Final traversal with relations What’s NEW in Field Image editing and filtering Field: embedded Processing An Incanter / Clojure / SVG workbench. We added support for Clojure (a relatively recent Lisp-like programming language) and Incanter (a statistics and visualization library for Clojure). This is partly as a proof of concept and partly in direct response to the needs of the graduate students of RPI, to close a gulf between environments where serious exploratory statistics work can be done (for example the programming environment “R”) and useful visualization work can happen (for example, Javascript + Google Visualization API). Part of this work resulted in a new Java Graphics2D / SVG / Field bridge to capture the output of visualization libraries that originate SVG files or Java drawing commands and re-inject this geometry back into high-speed Field rendering canvases. New language support for Field.Ruby has been added to the list of languages that Field supports. Work has started on bindings for the the audio specific programing language Supercollider. Mirah, which builds on Ruby, is an interesting language for data visualization because it compiles to fairly conventional, non-reflective Java – so it potentially scales far better to large datasets than Field’s core language, Python, which remains essentially interpreted. Supercollider is likely to be the language of choice for real-time DSP work, including not just the playback of sounds in Field but also realtime analysis. Both of these languages may have something to contribute as we enter the next phase of this project. • Key Tutorials and Use Examples (http://vimeo.com/user1225521/videos/page:4/sort:date) • “RelFinder in Field” tutorial. This is a long, detailed tutorial showing the step by step creation of a Field-based environment for visualizing relationships found within semantic web data. • “D3 in Field” tutorial. Here we duplicate the demo set of the D3 visualization framework in Field. This is a very carefully crafted, latest generation JavaScript based library for delivering visualizations inside browsers and it has provided a broad and perfectly typical range of visualization types for us to test Field’s basic visualization library against. • VSTO Ontology Explorer – continuing on from the “D3 in Field” work above, we constructed an interactive, navigable view of the ontologies associated with the Virtual Solar-Terrestrial Observatory. WebGL – The recent release into the mainstream of WebGL – the browser hosted JavaScript bindings for OpenGL – also closes the gap between Field’s graphics system and the possibilities of Field’s online experience. WebGL is the in-browser Javascript bindings to OpenGL, and it is now shipping in current versions of Chrome and Firefox. • GPU accelerated Force Directed Layout (FDL). One thing that Field’s graphics system can reach with relative ease that other runtimes essentially cannot is GPU accelerated versions of these algorithms. We have written a prototype layout implementation that remains interactive at vastly higher node counts than CPU implementations. By placing all of the implementation – geometry setup in Python together with GLSLangshader code – in a single environment we believe this implementation to be the clearest, most self-contained example of GPU accelerated FDL broadly available.