Download
1 / 11
110 likes | 199 Vues
Explore how Canadian family dynamics changed from 1920 to 2000, analyzing factors like size, marriage rates, divorce, and societal shifts. Witness the impact of historical events on family structures.

E N D
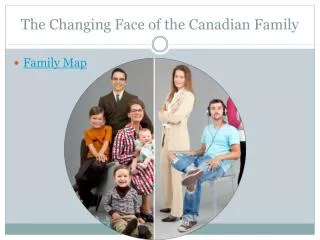
Change and the Canadian Family Timeline
1920’s • Decrease in the size of families • Why? • Consumer families • Implementation of child labour laws • Mandatory school attendance until 16 years • Migration to urban areas • WWI – husbands, brothers and sons reduced in #s
1930’s • Decrease in the size of families • Why? • Less social assistance • Great Depression • Less $ • Lone parents reach an all-time high not surpassed until 1996 • Married: 86.4% • Lone Parent: 13.6%
1940’s • Decrease in the size of families • Why? • Women in labour force • Following war there were higher divorce rates • Married: 87.8% • Lone Parent: 12.2%
1950’s • Increase in the size of families • Why? • Baby Boomers • High proportion of married persons at a younger age • Larger families • 3.9 children each • Teenagers become distinct age group • Married: 90.1% • Lone Parent: 9.9%
1960’s • Decrease in the size of families • Why? • Contraceptives (legalized in 1969) • Divorce Act “no fault” (no showing of wrongdoing by either party) • Average age of having 1st child is 23.6 years • Married: 91.6% • Lone Parent: 8.4%
1970’s • Decrease in the size of families • Why? • Divorce becomes more common • Married women work outside the home • Last census year that fertility was at replacement level (2.1 children = replacement) • Married: 90.6% • Lone Parent: 9.4%
1980’s • Decrease in the size of families • Why? • Divorce Act amended to reduce separation to 1 year • Record high divorce rates • 1st time common law marriages are counted • Married: 83.1% • Lone Parent: 11.3% • Common Law: 5.6 %
1990’s • Decrease in the size of families • Why? • 1 in 10 couples with children were step families • 2.1 million Canadians cared for senior family members • Married: 77.3% • Lone Parent: 13% • Common Law: 9.8%
2000’s • Decrease in the size of families • Why? • Same sex marriages become legal (2006 census) • 2001 – 41.19% of young adults 20-29 years lived in the parental home • 2006 – 43.5% • Married: 70.5 % • Lone Parent: 15.7% • Common Law: 13.8%
Factors • Women getting married later • Having children later 30 – 34 years • Age of majority – 18 years • 16 years with parents’ permission