Download
1 / 43
430 likes | 569 Vues
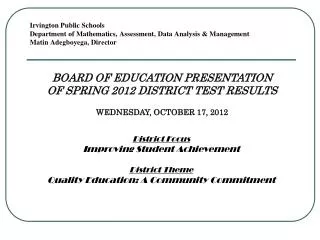
Irvington Public Schools Department of Mathematics, Assessment, Data Analysis & Management Matin Adegboyega, Director. BOARD OF EDUCATION PRESENTATION OF SPRING 2013 DISTRICT TEST RESULTS WEDNESDAY, OCTOBER 16, 2013 District Focus Improving Student Achievement District Theme

E N D
Irvington Public SchoolsDepartment of Mathematics, Assessment, Data Analysis & ManagementMatin Adegboyega, Director BOARD OF EDUCATION PRESENTATION OF SPRING 2013 DISTRICT TEST RESULTS WEDNESDAY, OCTOBER 16, 2013 District Focus Improving Student Achievement District Theme Quality Education: A Community Commitment
Grade 3 New Jersey Assessment of Skills and Knowledge Spring 2013 2013 NJASK 3: Review of Performance English Language Arts: - A decrease of 3.2% compared to the performance in 2012. - All schools except Berkeley Terrace and Florence Avenue decreased when compared to the performance in 2012. - Two (2) students scored in the advanced proficient category. - Two hundred eighteen (218) students out of the five hundred sixty-five(565) total students scored in the advanced proficient and proficient categories. Mathematics: - A decrease of 2.0% compared to the performance in 2012. - Four (4) schools decreased when compared to the performance in 2012. - One hundred two (102) students scored in the advanced proficient category. - Two hundred ninety-eight (298) students out of the five hundred sixty-seven (567) total students scored in the advanced proficient and proficient categories.
Irvington Public SchoolsNew Jersey Assessment of Skills & Knowledge - NJASK 3Comparative Analysis of Performance for Total Students with Valid Scale Scores1English Language Arts & MathematicsSpring 2011 - 2013 1 Excludes students who did not receive a scale score based on the full set of regular items in this content area 2 Percentages may not total 100 due to rounding
Irvington Public Schools New Jersey Assessment of Skills and Knowledge (NJASK)* Spring 2013 Grade 3 * Data from All Sections Roster without consideration to TIS < 1
Grade 4 New Jersey Assessment of Skills and Knowledge Spring 2013 2013 NJASK 4: Review of Performance English Language Arts: - A decrease of 4.0% compared to the performance in 2012. - Four (4) students scored in the advanced proficient category. - One hundred fifty-seven (157) students out of the five hundred forty-seven (547) total students scored in the advanced proficient and proficient categories. Mathematics: - An increase of 2.2% compared to the performance in 2012. - Forty-nine (49) students scored in the advanced proficient category. - Two hundred eighty-eight (288) students out of the five hundred forty-eight (548) total students scored in the advanced proficient and proficient categories. Science: - A decrease of 2.5% compared to the performance in 2012. - Ninety-one (91) students scored in the advanced proficient category. - Four hundred seven (407) students out of the five hundred forty-four (544) total students scored in the advanced proficient and proficient categories.
Irvington Public Schools New Jersey Assessment of Skills & Knowledge - NJASK 4 Comparative Analysis of Performance for Total Students with Valid Scale Scores1 English Language Arts, Mathematics, & Science 2011 - 2013 1 Excludes students who did not receive a scale score based on the full set of regular items in this content area 2 Percentages may not total 100 due to rounding
Irvington Public Schools New Jersey Assessment of Skills and Knowledge (NJASK)* Spring 2013 Grade 4 * Data from All Sections Roster without consideration to TIS < 1
Grade 5 New Jersey Assessment of Skills and Knowledge Spring 2013 • 2013 NJASK 5: Review of Performance • English Language Arts: - Chancellor Avenue School outperformed the DFG A by 18.0% - A decrease in percent proficient in most schools except an increase of 19.6% at Chancellor Avenue, 1.5% at Berkeley Terrace, and 2.7% at Florence Avenue. - Five (5) students scored in the advanced proficient category. - One hundred forty-five (145) students out of five hundred four (504) total students scored in the advanced proficient and proficient categories. • Mathematics: - Chancellor Avenue School outperformed the DFG A by 2.0% - A decrease in percent proficient in all schools except an increase of 7.1% atBerkeley Terrace. - Forty-seven (47) students scored in the advanced proficient category. - Two hundred forty-three (243 students out of five hundred four (504) total students scored in the • advanced proficient and proficient categories.
Irvington Public Schools New Jersey Assessment of Skills & Knowledge - NJASK 5 Comparative Analysis of Performance for Total Students with Valid Scale Scores1 English Language Arts & Mathematics Spring 2011 - 2013 1 Excludes students who did not receive a scale score based on the full set of regular items in this content area 2 Percentages may not total 100 due to rounding
Irvington Public Schools New Jersey Assessment of Skills and Knowledge (NJASK)* Spring 2013 Grade 5 * Data from All Sections Roster without consideration to TIS < 1
Irvington Public Schools Using Simple Matrix to Show Level of Improvement Comparing 2013 Test Results to 2012 NJASK 3 - 5 Most Improved: Improvement by double-digits Improved: Improvement by a number between 0.1 & 9.9 No Improvement: Scores about the same
Irvington Public Schools Using Simple Matrix to Show Level of Improvement Comparing 2013 Test Results to 2012 NJASK 3 - 5 Most Improved: Improvement by double-digits Improved: Improvement by a number between 0.1 & 9.9 No Improvement: Scores about the same
Grade 6 New Jersey Assessment of Skills and Knowledge Spring 2013 • 2013 NJASK 6: Review of Performance • English Language Arts: • - An increase of 4.7% in the proficiency level for the District. • - An increase in proficiency level for both middle schools; Union Avenue Middle by 5.1% and University • Middle by 4.9% • - One (1) student scored in the advanced proficient category compared to two (2) in 2012. • - One hundred thirty-one (131) students out of four hundred twenty-three (423) total students scored in the • advanced proficient and proficient categories. • Mathematics: - An increase of 6.1% in the proficiency level for the District. - An increase in the proficiency level for both middle schools; Union Avenue Middle by 5.6% and University Middle by 7.5% - Thirty-one (31) students scored in the advanced proficient category compared to thirty-three (33) in 2012. - Two hundred eighteen (218) students out of four hundred twenty-seven (427) total students scored in the advanced proficient and proficient categories.
Irvington Public Schools New Jersey Assessment of Skills & Knowledge - NJASK 6 Comparative Analysis of Performance for Total Students with Valid Scale Scores1 English Language Arts & Mathematics Spring 2011 - 2013 1 Excludes students who did not receive a scale score based on the full set of regular items in this content area 2 Percentages may not total 100 due to rounding
Irvington Public Schools New Jersey Assessment of Skills and Knowledge (NJASK)* Spring 2013 Grade 6 * Data from All Sections Roster without consideration to TIS < 1
Grade 7 New Jersey Assessment of Skills and Knowledge Spring 2013 2013 NJASK 7: Review of Performance English Language Arts: - An increase of 3.0% in proficiency for University Middle School, and a decrease of 2.5% in proficiency for Union Avenue Middle School. - Nine (9) students scored in the advanced proficient category; an increase of five (5) students compared to 2012. - One hundred fourteen (114) students out of four hundred sixty-seven (467) total students scored in the advanced proficient and proficient categories. Mathematics: - An increase in proficiency for the District by 0.9% - An increase of 9.4% in proficiency for University Middle School, and a decrease of 7.7% in proficiency for Union Avenue Middle School. - Twenty-three (23) students scored in the advanced proficient category, compared to twenty-two (22) students in 2012. - One hundred forty-five (145) students out of four hundred seventy-three (473) total students scored in the advanced proficient and proficient categories.
Irvington Public Schools New Jersey Assessment of Skills & Knowledge - NJASK 7 Comparative Analysis of Performance for Total Students with Valid Scale Scores1 English Language Arts & Mathematics Spring 2011 - 2013 1 Excludes students who did not receive a scale score based on the full set of regular items in this content area 2 Percentages may not total 100 due to rounding
Irvington Public Schools New Jersey Assessment of Skills and Knowledge (NJASK)* Spring 2013 Grade 7 * Data from All Sections Roster without consideration to TIS < 1
Grade 8 New Jersey Assessment of Skills and Knowledge Spring 2013 2013 NJASK 8: Review of Performance English Language Arts: - The district had an increase of 4.0% compared to the performance level in 2012. - An increase of 3.8% proficiency for Union Avenue Middle School and an increase of 5.9% proficiency for University Middle School - Eight (8 ) students scored in the advanced proficient category. - Two hundred twenty-nine (229) students out of four hundred thirty-five (435) total students scored in the advanced proficient and proficient categories. Mathematics: - The District had a decrease of 1.2% compared to the performance level in 2012. - An increase of 1.5% proficiency for Union Avenue Middle School and a decreaseof 1.4% proficiency for University Middle School. - Thirty-one (31) students scored in the advanced proficient category. - One hundred forty-six (146) students out of four hundred thirty-five (435) total students scored in the advanced proficient and proficient categories. Science: - A slight decrease of 0.4% compared to the performance level in 2012. - An increase of 0.8% proficiency for Union Avenue Middle School and 0.4% for University Middle School. - Forty-two (42) students scored in the advanced proficient category. - Two hundred sixteen (216) students out of four hundred thirty-three (433) total students scored in the advanced proficient and proficient categories.
Irvington Public Schools New Jersey Assessment of Skills & Knowledge - NJASK 8 Comparative Analysis of Performance for Total Students with Valid Scale Scores1 English Language Arts, Mathematics, & Science 2011 - 2013 1 Excludes students who did not receive a scale score based on the full set of regular items in this content area 2 Percentages may not total 100 due to rounding
Irvington Public Schools New Jersey Assessment of Skills and Knowledge (NJASK)* Spring 2013 Grade 8 * Data from All Sections Roster without consideration to TIS < 1
Irvington Public Schools Using Simple Matrix to Show Level of Improvement Comparing 2013 Test Results to 2012 NJASK 6 - 8 Most Improved: Improvement by double-digits Improved: Improvement by a number between 0.1 – 9.9 No Improvement: Scores about the same
Irvington Public Schools Using Simple Matrix to Show Level of Improvement Comparing 2013 Test Results to 2012 NJASK 6 - 8 Most Improved: Improvement by double-digits Improved: Improvement by a number between 0.1 – 9.9 No Improvement: Scores about the same
Irvington Public Schools Using Simple Matrix to Show Level of Improvement Comparing 2013 Test Results to 2012 NJASK 4 & 8 Most Improved: Improvement by double-digits Improved: Improvement by a number between 0.1 & 9.9 No Improvement: Scores about the same
2013 New Jersey Alternate Proficiency Assessment (NJAPA) • Highlights from the 2013 APA Performance • 71 students were evaluated for the 2013 APA; a decrease of five students compared to 2012. • Grade seven has the largest number of APA participants (13 students). • - 58 (about 81.7%) males participated in the APA compared to 13 (about 18.3%) females. • -12 students in grades 10 and 11 were evaluated in Science. • Language Arts Literacy (LAL) - An increase in percent proficient for total students in all grade levels, except grades 4 and 6, compared to percent proficient in 2012. • Mathematics - An increase in percent proficient for total students in grades 3 and 6when compared to percent proficient in 2012. Percent proficient decreased for grades 4, 5, and 7. • Science - An increase in percent proficient for total students in grades 4 and 11 compared to 2012.
Irvington Public Schools New Jersey Alternate Proficiency Assessment (NJAPA) Summary of District Performance for 2012 & 2013 * Includes Advanced Proficient N/A Not Applicable
Assessing Comprehension and Communication in English State to State for English Language Learners (ACCESS for ELLs) English Language Proficiency Test Spring 2013 2013 ACCESS for ELLs: Review of Performance - 719 students in grades K-12 took the ACCESS for ELLs test, an increase of 114 students when compared to 2012. - 44 students (25.88%) in grades K-12 were in the fifth English Language Proficiency level of Bridging. - 500 students (69.54%) had overall scores within the first three English Language Proficiency levels of Entering, Emerging, and Developing. - 170 students (23.64%) district-wide had overall scores in the fourth Proficiency level of Expanding. - 5 students (2.94%) in grades 1, 4, and 10 were in the sixth Proficiency level of Reaching.
Irvington Public Schools ACCESS for ELLs - English Language Proficiency Test Comparative Analysis of WIDA Language Proficiency Levels Using Overall Score1 by Grade Spring 2012 & 2013 1 Overall Score is the global indicator of English Language Proficiency and derived by combining the scale scores of the four language domains (Reading, Writing, Listening, and Speaking) according to their relative weights - 35% Reading + 35% Writing + 15% Listening + 15% Speaking. 2 Numbers within the six levels of Language Proficiency (Entering, Emerging, Developing, Expanding, Bridging, and Reaching) are the % of total
Irvington Public Schools New Jersey Biology Competency Test Summary of Results 2012 & 2013 New Jersey Biology Competency Test Summary of Results by Grade* May 2013 * Includes the Out-of-District Placement & Blue Knights Academy Students
Irvington Public Schools New Jersey Biology Competency Test (NJBCT) Comparative Analysis of Performance by Demographic Groups May 2013 Note:Special Needs Districts are Abbot Districts DFGA: District Factor Group A – Lowest Socioeconomic districts District: Irvington NS: No Student
HIGHLIGHTS FROM 2013 HSPA (GRADE 11) TEST RESULTS • For Total Population, there was a decrease of 5.6% in LAL and 3.3% in Math in 2013 compared to performance in 2012. • An increase of 9.2% in LAL performance and an increase of 28.9% in Math performance for Limited English Proficient (LEP) students in 2013. • Overall trend in the performances of General Education students indicates a decrease of 11.6% in LAL and 13.3% in Math in 2013. - Female students out-performed male students in LAL by 2.1%, while the male students performed higher than their female counterparts in Math by 0.4% • Economically disadvantaged students out-performed the Non-Economically disadvantaged students in Math by 11.8% 10/4/13
IRVINGTON HIGH SCHOOL HIGH SCHOOL PROFICIENCY ASSESSMENT (HSPA) MARCH TEST ADMINISTRATION FOR FIRST-TIME 11TH GRADERS ONLY ANALYSIS OF PERFORMANCE (% PROFICIENT*) 2009 - 2013 * Includes Advanced Proficient ** No Student coded as LEP +/- Increase / Decrease 1 2009 data compared to 2008 data Meeting the performance target will be computed after the third attempt of HSPA
Irvington Public Schools Comparative Analysis of March 2013 HSPA Performance by Demographic Groups - % Proficient* (Produced for First-Time 11th Graders Only) LANGUAGE ARTS LITERACY * Includes Advanced Proficient 1 Abbott Districts 2 District Factor Group A (Lowest Socioeconomic Districts) 3 District implies Irvington Township
Irvington Public Schools Comparative Analysis of March 2013 HSPA Performance by Demographic Groups - % Proficient* (Produced for First-Time 11th Graders Only) MATHEMATICS * Includes Advanced Proficient 1 Abbott Districts 2 District Factor Group A (Lowest Socioeconomic Districts) 3 District implies Irvington Township