
Uploaded by
tad
29 SLIDES
572 VUES
290LIKES
Describing Data: Displaying and Exploring Data
DESCRIPTION
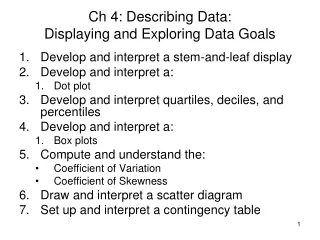
2. GOALS. Develop and interpret a dot plot.Compute and understand quartiles, deciles, and percentiles.Construct and interpret box plots.Compute and understand the coefficient of skewness.Draw and interpret a scatter diagram.Construct and interpret a contingency table.. 3. Dot Plots. A dot plot
Download

1 / 29
Download Presentation

Télécharger la présentation
Describing Data: Displaying and Exploring Data
An Image/Link below is provided (as is) to download presentation
Download Policy: Content on the Website is provided to you AS IS for your information and personal use and may not be sold / licensed / shared on other websites without getting consent from its author.
Content is provided to you AS IS for your information and personal use only.
Download presentation by click this link.
While downloading, if for some reason you are not able to download a presentation, the publisher may have deleted the file from their server.
During download, if you can't get a presentation, the file might be deleted by the publisher.
E N D
Presentation Transcript
1. Describing Data: Displaying and Exploring Data Chapter 4


More Related
Audio
Live Player