Download
1 / 23
260 likes | 471 Vues
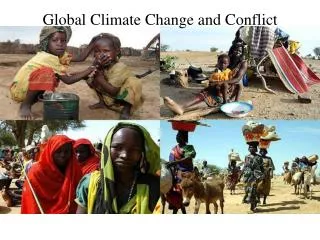
Climate Change and Conflict. Catherine Thomasson, MD Physicians for Social Responsibility. Risk Factors for Conflict. Competition for scarce resources Migration Partial social structures/gov’t control Demographic & economic inequities G ender inequality, youth bulge/unemployment

E N D
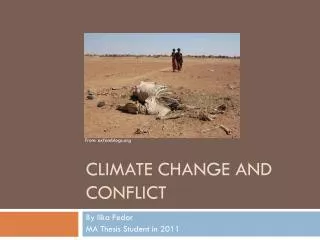
Climate Change and Conflict Catherine Thomasson, MD Physicians for Social Responsibility
Risk Factors for Conflict • Competition for scarce resources • Migration • Partial social structures/gov’t control • Demographic & economic inequities • Gender inequality, youth bulge/unemployment • Abundance of lootable resources Slide c/o CL Parker, Johns Hopkins Bloomberg School of Public Health, 2013
How Climate Change Affects Environmental Resources Sea level rise Coastal flooding, damage Climate Change Extreme weather events Infestation ↑ runoff rates More frequent droughts, floods Changed hydro cycles transpiration rates, soil moisture, precipitation patterns water, food Deforestation Reduced irrigation capacity Erosion, silting Degradation of farm landerosion, nutrient depletion, compacting, salinization, loss to urbanization Overuse, pollution of water supplies Adapted from Homer-Dixon 1999 Slide c/o CL Parker, Johns Hopkins Bloomberg School of Public Health, 2013
Water Availability • 2.3 billion people live in water stressed areas • 1.7 billion live in water scarce areas* By 2025: 3.5 billion people projected to live in water stressed areas • 2.4 billion in water scarce areas* By 2100: 1/3 world risk of extreme drought** • *UNEP // **Burke et.al. Journal of • Hydrometeorology Sept. 2006
Food Supply and Climate Change • Grain yields by 10% for every 1°C in global average surface T° • 2°C to 3°C likely; 3°C to 5°C possible • Therefore 20% to 30% likely; • 30% to 50% possible Slide c/o CL Parker, Johns Hopkins Bloomberg School of Public Health, 2013
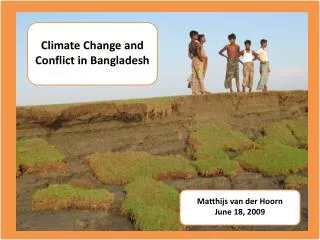
Syria • Pop: 22 million • Size of N. Dakota • Hot and dry in summer, rainy and mild in winter • Was a middle income developing country • 11% below the poverty line (0.06% less than U.S.) • 10% of pop in 2007 were refugees (Iraqi, Palestinian, Lebanese) • Repressive government/some corruption
Syria Vegetation Health Index • From 2006 to 2011: • 60 percent of land affected by drought • 1 million in 2007 with (75%) crop loss • Herders sold animals for 60-70% below original price • Required wheat importation for first time. • Sandstorms were happening up to twice a week. http://www.preventionweb.net/english/hyogo/gar/2011/en/bgdocs_Erian_Katlan_&_Babah_2010.pdf
Drought drives significant percentage of 1.3 million who lost 75% of crop in 2007 off land to cities. Did this cause the civil war?
The Global Food System and Climate Change CLIMATE CHANGE Social, Political & Economic Factors Meat consumption Population Technology Conflict Policies Poverty/Inequality Economic Development Income Food Prices Food Aid Adaptation Resilience vs Vulnerability Global Food Production Global Food Production Sectors Agriculture Livestock Wild Fisheries Aquaculture Sectors Agriculture Livestock Wild Fisheries Aquaculture Individual Food Supply Resources Land Water Energy Soil Labor Global Food Supply ? Distribution Resources Land Water Energy Soil Labor Access • Slide c/o CL Parker, Johns Hopkins Bloomberg • School of Public Health, 2013
Quantifying the Influence of Climate on Human Conflict • 60 quantitative studies • Associations between climate variables and conflict over time S M Hsiang et al. Science 2013;341:1235367
Climate and Interpersonal Violence S M Hsiang et al. Science 2013;341:1235367
Hsiang conclusions: Personal Violence/Crime and Climate • More violent behavior in high temperature climates. • In low-income settings, extreme rainfall events that adversely affect agricultural income are associated with higher rates of personal violence and property crime. • High temperatures associated with increased property crime, but most with violent crimes
Group-Level Violence and Political Instability • Intergroup political conflict increases in low-income areas with • Low water availability • Very low temperatures • Very high temperatures. • Political conflicts often have a direct link a to climate-induced changes in income. • Reports of effect of climate on conflict is relatively standard: consistent with 35 studies of modern data and 28 other studies of intergroup conflict.
Kenya: deforestation less rain and more run-off water scarcity hundreds killed in inter-ethnic water wars • Most water conflict has been intra-national
Gleick’s typology of historicalwater conflicts: • Control of Water Resources:water supplies or access are at the root of tensions • Military Target: where water resources/systems are targets of military actions by nations or states • Military Tool: water resources/systems used as a weapon during a military action • Political Tool: water resources/systems themselves used for a political goal • Terrorism: water resources/systems are targets or tools of violence or coercion by non-state actors • Development Disputes: water resources/systems are a major source of contention/dispute in context of economic development www.pacinst.org
Environmental Scarcity and Conflict ↓ water, food “Supply-induced scarcity” Migration, expulsion Ethnic conflicts Population growth “Demand-induced scarcity” Increased environmental scarcity Weakened states Coups d’état Unequal resource access “Structure-induced scarcity” Decreased economic productivity Deprivation conflicts Adapted from Homer-Dixon 1999
A Case Study: Gaza Supply-induced Scarcity: • Almost all freshwater comes from groundwater • Annual rainfall = 70 - 140 million cubic meters • 60% of that becomes runoff to Mediterranean or is lost to evaporation • Only 40% left to recharge single freshwater aquifer • Aquifer is shallow, >90% is contaminated by sewage, agricultural runoff, and saltwater • 50-60 million cubic meters = sustainable supply Slide c/o CL Parker, Johns Hopkins Bloomberg School of Public Health, 2013
Consumption of Groundwater in Gaza Demand-induced scarcity: • Consumption: 3x natural supply • Population increases Slide c/o CL Parker, Johns Hopkins Bloomberg School of Public Health, 2013
Structural Scarcity • Strict quotas on Palestinian consumption • Frozen at 1967 levels • Palestinians: 137m³/person—Israelis: 2000m³/person • Palestinians prohibited from drilling new wells or repairing water/sewer infrastructure • Uneven pricing schemes • Palestinians pay 20 times what Israeli settlers pay for water • Neighborhood desalination provide fresh drinking water to ~20% population; rest buy bottled drinking water Families pay 1/3 their monthly income for water
Dept of Defense Study 2013: • Climate impacts are observable, measurable, real, and having near and long-term consequences” • Failure to anticipate and mitigate these changes, the report states, “increases the threat of more failed states with the instabilities and potential for conflict inherent in such failures.”
Environmental Peacemaking • Scarce resources can be used as a tool • Cooperate to manage environmental resources • transform insecurities and • create more peaceful relationships between parties in dispute • overcome political tensions • promoting interaction, confidence building, and technical cooperation -Geoffrey D. Dabelko, Woodrow Wilson International Center for Scholars Slide c/o CL Parker, Johns Hopkins Bloomberg School of Public Health, 2013
Join Together for Change www.PSR.org 202-667-4260
Minerva Initiative of the U.S. Pentagon Engage scientific community to identify • Regions of high risk • Elements of climate change related risk • Food, water, migration, disaster, population, disease • Elements of resilience • What allows communities faced with catastrophe to NOT devolve into conflict? • How can the US assist in fostering these elements to prevent future conflict