Community Assembly
Community Assembly. A pervasive theme in community ecology is that the species composition of a community is governed by deterministic “assembly rules” Typically these rules emphasize the importance of interspecific interactions (e.g. niche overlap, body size distributions). Community Assembly.
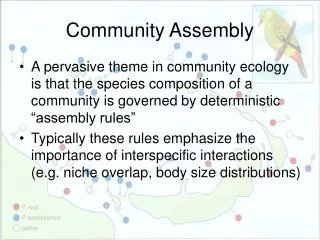

Community Assembly
E N D
Presentation Transcript
Community Assembly • A pervasive theme in community ecology is that the species composition of a community is governed by deterministic “assembly rules” • Typically these rules emphasize the importance of interspecific interactions (e.g. niche overlap, body size distributions)
Community Assembly • In this section we will focus on assembly rules that predict the presence or absence of particular species combinations
Community Assembly:laboratory evidence? • The best evidence: laboratory studies • Gilpin et al. (1986) examined the structure of Drosophia communties. • When communities were established with 10 (of 28 considered) species, the subsequent stable community was always fewer than four species • 210=1024 initial combos, <12 persist
Community Assembly:field studies • Ant communities in Florida mangroves • Two ‘primary’ species, limited by island size; formed a checkerboard pattern • Two ‘secondary’ species, limited by presence of ‘primary’ species
Diamond’s Assembly Rules • Diamond (1975) popularized the study of community assembly in a detailed account of the distribution of 141 land-bird species on New Guinea and its satellite islands in the Bismark Archipeloago
Diamond’s Assembly Rules • 1) ‘if one considers all the combinations that can be formed from a group of related species, only certain ones of these combinations exist in nature’ • 2) ‘these permissible combinations resist invaders that would transform them into forbidden combination’
Diamond’s Assembly Rules • 3) ‘a combination that is stable on a large or species-rich island may be unstable on a small or species-poor island’ • 4) ‘on a small or species-poor island a combination may resist invaders that would be incorporated on a larger or more species-rich island’
Diamond’s Assembly Rules • 5) ‘some pairs of species never coexist, either by themselves or as part of a larger combination’ • 6) some pairs of species that form an unstable combination by themselves may form part of a stable larger combination’ • 7) ‘some combination that are composed entirely of stable sub-combinations are themselves unstable’
Diamond’s Assembly Rules • Although not explicitly stated, the rules infer competition (forbidden combinations) • Some of the rules are so general it has been very difficult to make them operational
Diamond’s Assembly Rules • In 1979, Conner and Simberloff attacked Diamond’s study suggesting Rules 2,3,4,6, and 7 were either tautologies or restatements or other rules • Rules 1 and 5 are identical, just differing on ‘related species’
Diamond’s Assembly Rules • Rule 5 describes a chekerboard pattern of species occurrences, which is perhaps the simplest of Diamond’s assembly rules. • The rule for a ‘complete’ checkerboard pattern is very stringent: two species may never co-occur (99 of 100)
Diamond’s Assembly Rules • Checkerboard distribution of two Macropygia cuckoo-dove species in the Bismarck Archipelago
Diamond’s Assembly Rules • But, is it really that surprising? • With (2141) =9,870 possible species pairs, 7 pairs showing exclusive distributions may not be surprising… • Because Diamond did not publish original data, Conner and Simberloff used other data
Null Assembly ModelsR-mode analyses • They constrained the observed presence-absence matrix subject to the following three constraints: • 1) row totals of RMatrix were maintained • Constraint: maintains the differences between species in their frequency of occurrence
Null Assembly Models • 2) column totals of the RMatrix were maintained • Constraint: maintained differences among islands in the number of species they contained
Null Assembly Models • 3) for each row, species occurrences were restricted to those islands for which total species richness fell within the range occupied by the species • Constraint: maintained the observed incidence function for each species (it could not occur in assemblages larger or smaller than those observed)
Null Assembly Models • Although the constraints were too much for matrices with a large number of widespread species, recent advances in randomization algorithms have overcome this shortcoming
Null Assembly ModelsMatthews • Matthews (1982) analyzed the occurrence of 13 minnow species distribution in six streams of the Ozark watershed • Although some species pairs that never co-occurred in watershed were morphologically and ecologically similar, the observed number of checkerboard pairs matched the predictions of the null model (although assumed binominal distribution)
Null Assembly ModelsCriticisms • The dilution effect: because C&S analyzed confamilial groups or entire avifaunas, competitive effects were no apparent • Diamond’s choice of examples suggested that the ecological guild was the correct unit of measure (although guild identification is not always easy or apparent)
Null Assembly Models • For example, Graves and Gotelli (1993) tested the significance of checkerboard distributions in mixed-species flocks of Amazonian forest birds • Results: No difference for the entire assemblage of flocking or for guilds • Only a difference when analysis was restricted to congeneric species within feeding guilds
Null Assembly ModelsCriticisms • Effects of randomization constraints: the 3 constraints of C&S were severe and made it less likely that the null hypothesis would be rejected • For example, relaxing the ‘incidence function’ constraint, the New Hebrides matrix revealed a significant negative association
Null Assembly ModelsCriticisms • Also, does the assumptions of C&S have their flaws? What if the incidence frequency is actually influenced by competition? (or some other force) • How would you test this? • Compare archipelagoes with varying numbers of competitors and see if their occurrence frequency varies
Null Assembly ModelsCriticisms • Also, some have claimed that is circular to constrain marginal totals, because the marginals also reflect interspecific competition • If true, a separate analysis for determining the total number of island occurrences is a separate hypothesis and requires a separate null model (however, competition may not be only factor in island distribution)
Null Assembly ModelsCriticisms • Should marginal constrains be incorporated into null model at all? • View 1: co-occurrence patterns are nonrandom, given the observed ‘sample’ of species and islands (appropriate) • View 2: the randomization is viewed as a model of community colonization in the absence of competition (not appropriate)
Null Assembly ModelsCriticisms • Significance tests: C&S compared the observed and expected distributions with a chi-squared test • May not be appropriate due to constraints of marginal totals (non-linear)
Other Null Models • Wright and Biehl (1982) suggested a “shared-island” test for detecting unusual species co-occurrences • For each species pair, they calculated the tail probability of finding the observed number of co-occurrences, but with R&C transposed
Wright and Biehl (1982) • Advantage: directly pinpoints particular species pairs that show aggregated or segregated distributions (however a few pairs can unduly influence statistics) • Problem: assumes all sites are equivalent, thus confounds species-site associations with the effects of species interactions
Analyzing +/- Matrix • Two modes of analysis Q-mode and R-mode • Q-mode analysis assesses the similarity of different columns, indicating how similar sites are in the species they contain • R-mode compares the rows of the matrix and indicates how similar species are in the set of islands they occupy
Q-mode: biogeograpy • How to quantify the degree of similarity between ≥2 islands? • Biogeographers have developed such tools as Jaccard’s Index (0-1) J = Nc / (N1 + N2 –Nc) But it lacks a statistical distribution. So what? What would your null model be?
A simple colonization model (0) • Johnson (unpublished 1974 presentation) used the number of shared species as a simple index of similarity between sites and then asked what should be the number of shared species under the simplest colonization model (Null 0) Ess = mn / P • (Two islands with m & n species, P # in the equiprobable source pool)
Small-island Limitation (Null 1) • Habitat availability might be responsible for the fact that most sites shared more species than expected compared with Null Hypothesis 0 • In particular, species may be missing from small islands (lacking appropriate habitat) Ess = mn / Pn (where Pn is # of sp. in pool of larger island (m≤n)
Island Limitation • There could also be a size restriction, but from the other direction • Islands could be too big, not allowing for ‘’supertramp’ species to persist • To incorporate this constraint, you could limit your source pool to only those species which occur on islands of a particular size or larger
Island Limitation • The probability of occurrence is influenced by community size, island area, or attributes (e.g. distance) and can be incorporated as an ‘incidence function’
Nonrandom Dispersal (Null II) • Null 0 assumes colonization is identical • If colonization is stochastic, species still would be expected to occur at different frequencies on islands because they differ in their abilities to disperse and persist • However, the attributes related to disperal and persistence (body size, population size, geographic range size) are difficult to assess
Nonrandom Dispersal (Null II) • What to do? • So one option is to use the “occurrence distribution” to weight species (circular?) • However, marginal constraints do not determine the occurrence pattern itself • Constraints can be absolute or probabilistic (more later…)
Problems with Q-mode • Competition may not be being assessed as pairwise island comparisons because many are between islands that have the same species sets. Consequently, it would fail to detect a significant ‘checkerboard effect’ • Second, because the pairs of islands are not independent, it is not appropriate to ask whether more than 5% of the pairs are significantly different from expectation
Summary of Q- and R-mode • Q-mode appears strong to test for biogeographic grouping (similarities) • R-mode is better to assess species interactions (i.e. competition) at sites shared in common
Gilpin and Diamond • Gilpin and Diamond (1982) developed their own ‘R-mode’ analysis • For species i on island j, they calculated the probability of occurrence as Pij = RiCj / N • Where R is the row total for species i and C is the column total for island j and N is the grand total
Gilpin and Diamond • Next, they calculated the expected overlap for each species pair by summing the product of these probability across all islands • Observed and expected overlaps for each species pair were standardized and then compared with a chi-squared test
Gilpin and Diamond • If the null hypothesis of independent placement were true, the histogram of normalized deviates would follow a normal distribution with unusual aggregation at the right and unusual segregation at the left • Upon re-testing the New Hebridean birds, no new differences were found
Gilpin and Diamond • However, the original Bismarck data, they found a strong excess of positive association and a weak excess of negative associations (but overall placed less emphasis on competitive interactions dictating community structure) • Importance: introduced idea that marginal totals (min & max) were expectedvalues, not absolute constraints
Gilpin and Diamond • How? In different runs of a stochastic model, we would not expect each island to support precisely the observed number of species, or each species, to always occur with its observed frequency. • In fact, putting a cap on species numbers could be interpreted as a competitive ‘cap’ or limit • Instead, islands are treated as ‘targets’ independently by species with some variance about the expected species number in the null model
Summary of R-mode Analysis • The controversy over R-mode analysis reduces to four issues: • 1)Which species and which islands should be analyzed? • Issues such as source pools, colonizations potential, habitat availability should be considered before any analysis is conducted
Summary of R-mode Analysis • 2) Which metric should be used? • What is the proper way to quantify nonrandomness and species associations in the +/- matrix • Since there are many different kinds of ‘structure’ in a +/- matrix, we will utilize five different metrics
Summary of R-mode Analysis • 2) Which metric should be used? • A) the number of species combinations • If assembly rules are operative, there should be fewer species combinations than expected • B) the number of checkerboard distributions • Is the most testable of the ‘Diamond Rules’ and represent the strongest form of species competition (complete species repulsion)
Summary of R-mode Analysis • 2) Which metric should be used? • C) the “checkerboardness” index of Stone and Roberts (1990) • Measures the overall tendency for species pairs to co-occur. May reveal competitive pairs, but not occuring in a perfect checkerboard • D) the “togetherness” index of Stone and Roberts (1992) • Measures overall tendency of species to co-occur (although both positive and negative are possible)
Summary of R-mode Analysis • 2) Which metric should be used? • E) Schulter’s Variance Ratio (1984) • A modified version of checkerboardedness; this measure does not constrain column totals • Different patterns of negative covariation may be revealed by comparing the variance ratio to null model predictions
Summary of R-mode Analysis • 3) Which simulation procedure should be used? • If we accept that C&S were correct in that neither islands nor species are equiprobable, this should be reflected in the null model • Connor and Simberloff (RxC too constrained) • Gilpin and Diamond (RxC expectations)