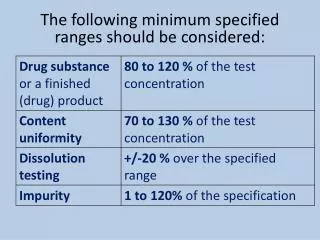
The following minimum specified ranges should be considered:
240 likes | 380 Vues
This article delves into the concepts of accuracy and precision in experimental methods. Accuracy reflects how closely a measurement aligns with a true value, while precision indicates repeatability of results across multiple determinations. Commonly used metrics for accuracy include absolute and relative errors, alongside percent recovery assessments. Precision, assessed through standard deviation, showcases the reliability of measurements. The document also covers methods of determining limits of detection (LOD) and quantitation (LOQ) with statistical approaches.

The following minimum specified ranges should be considered:
E N D
Presentation Transcript
The following minimum specified ranges should be considered:
4. Accuracy and Precision Accuracy: The degree to which an experimental result approaches the true or accepted answer Accuracy – nearness to the truth .
Ways to Describe Accuracy: Error:The difference between the result obtained by a method and the true or accepted value. Absolute Error d = (X – µ) where: X = the experimental result µ = the true result All Methods, except counting, contain errors – don’t know “true” value
Example • Atomic absorption analysis of As+3 and pb+2 in a sample yield the following results As+3 = 600 µg.ml-1 d = 5 µg. ml-1 pb+2 = 9 µg.ml-1 d = 0.3 µg.ml-1 From absolute error As+3 results is less accurate than pb+2 results but is not true as we see from relative error. E rel As+3 = 5/600 x100 =0.83% E rel pb+2 = 0.3/9 x100 = 3.3 % As+3 results is more accurate, although it has larger absolute error.
Accuracy should be assessed • Using a minimum of 9 determinations over a minimum of 3 concentration levels covering the specified range (e.g. 3 concentrations /3 replicates each of the total analytical procedure). • Accuracy should be reported as percent recovery
Precision • Precision: The degree to which an experimental result varies from one determination to the next. Precision - reproducibility
Ways to Describe Precision: • Absolute Standard Division If the results are normally distributed, 68.3 % of the results can be expected to fall within the range of ± 1 σof the mean as a result of random error.
2. Relative Standard deviation: 3. Confidence limits We might use this to estimate the probability that the population mean (µ) lies within a certain region centered at
Example A pharmacist determined the % of vitamin C in Rino C Tablets, obtaining the following results, = 15.3 σ = 0.1 n= 4 Calculate the confidence limit of the mean at probability90% and 99% (t =2.353 at 90 % probability and, 5.841 at probability 99%) Solution µ = 15.3 ± 2.353 x 0.1/√4 µ = 15.3 ± 0.12 µ = 15.3 ± 5.841 x 0.1/√4 µ = 15.3 ± 0.29
Repeatability should be assessed using: • A minimum of 9 determinations covering the specified range for the procedure (e.g. 3 concentrations/3 replicates each) or • A minimum of 6 determinations at 100% of the test concentration. Recommended Data: The standard deviation, relative standard deviation (coefficient of variation) and confidence interval should be reported for each type of precision investigated.
Chromatogram of the same concentration of Norfloxacin; (a) 5 mg% and the same concentration of Salicylic acid, (d) 2 mg% id at 274 nm.
Method Validation- LOD and LOQ Sensitivity • Limit of detection (LOD) – “the lowest content that can be measured with reasonable statistical certainty.” إحصائية معقولة من اليقين • Limit of quantitative measurement (LOQ) – “the lowest concentration of an analyte that can be determined with acceptable precision (repeatability) and accuracy under the stated conditions of the test.” How low can you go?
Detection Limit • smallest concentration which can be reported with a specified degree of certainty by a definite, complete analytical procedure.
Methods of determination (depending on whether the procedure is a non-instrumental or instrumental.) • Based on: • Visual Evaluation • Signal-to-Noise • The Standard Deviation of the Response and the Slope • the Standard Deviation of the Blank • the Calibration Curve
Based on Visual Evaluation Is determined by the analysis of samples with known concentrations of analyte and by establishing the minimum level at which the analyte can be reliably detected. • Signal-to-Noise Typically 3 times the signal-to-noise (based on standard deviation of the noise) تداخل موجات
The Standard Deviation of the Response and the Slope The detection limit (DL) may be expressed as: DL = 3.3 σ/S • σ = the standard deviation of the response • S = the slope of the calibration curve • The slope S may be estimated from the calibration curve of the analyte. The estimate of σ may be carried out in a variety of ways, for example: • Based on the Standard Deviation of the Blank • Based on the Calibration Curve
Quantitation limit • The minimum level at which the analyte can be quantified with acceptable accuracy and precision.
Based on Signal-to-Noise Approach Typically 10 times the signal-to-noise (based on standard deviation of the noise) • Based on the Standard Deviation of the Response and the Slope The quantization limit (QL) may be expressed as: QL = 10σ/ S Where s= the standard deviation of the response S = the slope of the calibration curve The slope S may be estimated from the calibration curve of the analyte. • The slope S may be estimated from the calibration curve of the analyte. The estimate of σ may be carried out in a variety of ways, for example: • Based on the Standard Deviation of the Blank • Based on the Calibration Curve
Robustness • Robustness of an analytical procedure is a measure of its capacity to remain unaffected by small but deliberate variations in method parameters. It should show the reliability during its usage. • Examples of typical variations are: • 1. stability of analytical solutions, • 2. extraction time. • Examples In the case of liquid chromatography, • variations of pH in a mobile phase • variations in mobile phase composition, • different columns (different lots and/or suppliers), • temperature, • flow rate. • In the case of gas-chromatography, examples of typical variations are different columns, temperature, flow rate.
Ruggedness • Ruggedness of an analytical method is the degree of reproducibility of the results obtained by the analysis of the same sample under a variety of normal test conditions. For example different • laboratory, • analysts, • instruments, and • reagents.
System suitability testing • The tests are based on the concept that the equipment, electronics, analytical operations and samples to be analyzed constitutes an integral system that can be evaluated as such. ويشكل نظاممتكامل يمكن تقييمه على هذا النحو