Bioanalytical methods validation for pharmacokinetic studies
1.23k likes | 1.92k Vues
ECOLE NATIONALE VETERINAIRE T O U L O U S E. Bioanalytical methods validation for pharmacokinetic studies. P.L. Toutain Toulouse Feb. 2008. Validation methods.

Bioanalytical methods validation for pharmacokinetic studies
E N D
Presentation Transcript
ECOLE NATIONALE VETERINAIRE T O U L O U S E Bioanalytical methods validation for pharmacokinetic studies P.L. Toutain Toulouse Feb. 2008
Validation methods • Selective and sensitive analytical methods for the quantitative determination of drugs and their metabolites (analytes) are critical for successful performance of PK and bioequivalence studies
Validation methods • Validation of analytical methods includes all the procedures recommended to demonstrate that a particular method, for a given matrix, is reliable and reproducible
Validation methods • A priori validation: • Pre-study validation for analytical method development and method establishment • In-life validation (Routine validation)
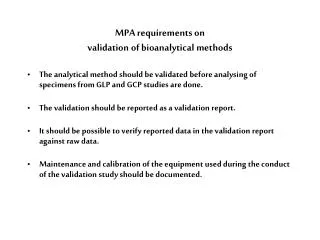
Regulatory requirements • G.L.P. • (e.g.; bioequivalence, Toxicokinetics) • S.O.P. (standard operating procedure) • (from sample collection to reporting) • Record keeping • Chain of sample custody (chaîne des garanties) • Sample preparation • Analytical tools • Procedures for quality control and verification of results
A priori validation makes sure the method is suitable for its intended use
A priori validation: criteria to be validated • Calibration curve • Accuracy • Precision (repeatability, reproducibility) • Limit of quantification (LOQ) • Limit of detection (LOD) • Sensitivity • Specificity/selectivity • Stability of the analyte in the matrix under study • Others (ruggedness, agreement,…)
Calibration curve Definition It is the relationship between known concentrations and experimental response values Goal Determine the unknown concentration of a sample
Yn y1 xn x1 Calibration curve Y Response: dependent variable (peak,area ..) y = ax + b Y (observed) Independent variable: exactly known concentrations X
Yn y1 xn x1 Calibration curve Y Response: dependent variable y = ax + b Y (observed) Independent variable: ^ X X estimated concentration
Calibration curve Response Response ^ ^ x x GOOD BAD
Calibration curve • Construction • 5 to 8 points over the analytical domain • replicates are required to test linearity • 3 to 5 replicates per levels
Calibration curve • The calibration curve should be prepared in the same biological matrix (e.g. plasma ) as the sample in the intended study by spiking with known concentration of the analyte (or by serial dilution).
Reference Standard • Calibration standards and quality control samples (QC) • Authenticated analytical reference standard should be used to prepare (separately) solution of known concentration • certified reference standards • Never from a marketed drug formulation • commercially supplied reference standards • other material of documented purity
Building the calibration curve: a regression problem • In statistics, regression analysis is a statistical technique which examines the relation of a dependent variable (response variable or dependent variable i.e. Y) that is for us the response of the analytical apparatus (peak, area..) to specified independent variables (explanatory variables or independent variable i.e. X) that is for us the concentration of calibrators .
Linear regression : see Wikipedia • Linear regression - Wikipedia, the free encyclopedia
Linear regression : Wikipedia • In statistics, linear regression is a regression method that models the relationship between a dependent variable Y, independent variables Xi, i = 1, ..., p, and a random term ε. The model can be written as: • where β0 is the intercept ("constant" term), the βis are the respective parameters of independent variables, and p is the number of parameters to be estimated in the linear regression.
Linear regression : Wikipedia • This method is called "linear" because the relation of the response (the dependent variable Y) to the independent variables is assumed to be a linear function of the parameters.
Linear regression : Wikipedia • It is often erroneously thought that the reason the technique is called "linear regression" is that the graph of Y = β0 + βx is a straight line or that Y is a linear function of the X variables. But if the model is (for example) • the problem is still one of linear regression, that is, linear in x and x2 respectively, even though the graph on x by itself is not a straight line. In other words, Y can be considered a linear function of the parameters (α, β, and γ), even though it is not a linear function of x.
Statistical requirements to build a calibration curve • Standard concentration (X) are known without error • Variance of response (Y) should be constant over the analytical domain (homoscedasticity hypothesis); this equivalent to say that the random errors εi are homoscedastic i.e., they all have the same variance. • The random errors εi have expected value 0. • The random errors εi should be independent from Y and are uncorrelated. These assumptions imply that least-squares estimates of the parameters are optimal in a certain sense
Regression can be used for prediction • These uses of regression (calibration curve) rely heavily on the model assumptions being satisfied. • Calibration curve is misused for these purposes where the appropriate assumptions cannot be verified to hold • The misuse of regression is due to the fact that it take considerably more knowledge and experience to critique a model than to fit a model with a software.
Assessing the calibration curve the calibration curve (here a statistical model ) should be checked for two different things: • Whether the assumptions of least-squares are fulfilled • Analysis (inspection) of residuals • Whether the model is valid and useful • Test of linearity • Back calculations
Validation of the calibration curve • Homogeneity of variance • Linearity • Back calculations
Checking model assumptions • The model assumptions are checked by calculating the residuals and plotting them. • The residuals are calculated as follows :
Inspection of residuals The following plots can be constructed to test the validity of the assumptions: • A normal probability plot of the residuals to test normality. The points should lie along a straight line. • Residuals against the explanatory variables, X. • Residuals against the fitted values, Y . • Residuals against the preceding residual. • There should not be any noticeable pattern to the data in all but the first plot
Validation of the calibration curve Homogeneity of variance
Calibration curve: homogeneity of variance Problem of the homogeneity of variance Cochran's test Homogeneous Non homogeneous "cone shaped"
Calibration curve: linearity & homogeneity of varianceInspection of a residuals plot If the linear model and the assumption of homoscedasticity are valid, the residual should be normally distributed and no trends should be apparent
Calibration curve: linearity & homogeneity of varianceInspection of a residuals plot The fact that the weighted residuals show a fan-like pattern, getting larger as X increase suggest heteroscedasticity and the use of a weighting procedure to reduce variance heterogeneity
Calibration curve: homogeneity of variance • Heterogeneity of variance • Commonly observed • Y has often a constant coefficient of variation • Weighted regression • weighing factor proportional to the inverse of variance (1/X, 1/X²…) • After weighing, the coefficient of correlation (r) can be lower but accuracy and precision of prediction are better
Calibration curve: homogeneity of variance Weighing factor=1/x2
Inspection of the residual plot Weighted residues Unweighted residues Misfit evidenced by visual inspection of residuals despite the use of weighted regression: does the simple linear model holds???
Calibration curve : Linearity - Specific tests of linearity should be used - The coefficient of correlation (r) cannot assess linearity except for r = 1 e.g.: r = 0.999 can be associated with a calibration curve which is not a straight line
Calibration curve: linearity Test of linearity : Coefficient of correlation Y Response r = 0.99 does not prove linearity X Concentration
Calibration curve: linearity • Test of lack of fit • Requires replicates • Should be carried out after weighing • ANOVA
Calibration curve: linearity Test of lack-of-fit It is a comparison of 2 variances Y Response X Concentration Variance 2 Mean estimated from the curve Variance 1 Mean estimated from each set of data ? = The case of very precise technique
Calibration curve: linearity • If no replicate • Y = ax + b vs Y= ax + cx² + b Test the significance of C Y Y X X
Calibration curve: linearity • If non linearity • use the 2nd degree polynom • reduce the domain of the calibration curve
Calibration curve:Weight=1/X2 & quadratic component Linear & Unweighted residues Quadratic & Weighted residues Linear & Weighted residues
Validation of the calibration curve:Back calculations • back calculation of the concentrations of calibration samples using the fitted curve coefficients • The ULOQ calibrator must back-calculate to within ±15% of the nominal concentration. • At least four out of six non-zero standards should meet the back-calculation criteria, including the LLOQ and ULOQ standards.