Distribution
2014 Transmission & Distribution Benchmarking Data Review Conference. Distribution. June 25-27, 201 4 Nashville , TN. Agenda. Introduction Statistics and System Activity Guidelines Statistical Report Anomalies, Issues, Outliers and Corrections Financial Guidelines Statistical Report

Distribution
E N D
Presentation Transcript
2014 Transmission & Distribution Benchmarking Data Review Conference Distribution June 25-27, 2014 Nashville, TN
Agenda • Introduction • Statistics and System Activity • Guidelines • Statistical Report • Anomalies, Issues, Outliers and Corrections • Financial • Guidelines • Statistical Report • Anomalies, Issues, Outliers and Corrections • Practices • Guidelines • Statistical Report • Anomalies, Issues, Outliers and Corrections • Next Steps
Purpose of the Section • The purpose of this section of the questionnaire is twofold: to gather statistical information about the existing electric system, and then to gather further information about activities during the year that affect the system and the company. • The statistical section gathers a variety of demographic information that describes each company's system in terms of size, voltage, customer density, etc. This information is used in doing analysis of the results, understanding the inherent advantages and limitations of the circumstances facing each utility. • The system activity portion of the questionnaire is designed to identify work load drivers associated with activity. There are a variety of questions designed to understand the amount of capital activity as well as things that are done for O&M.
Transmission versus Distribution Transmission classes >=45kV • <69kV class (>=45kV <69kV) • 69kV class (>=69kV <100kV) • 100kV class (>=100kV <200kV) • 200kV Class (>=200kV <300kV) • 300kV Class (>=300 kV <400 kV) • 400kV and above • For purposes of this survey, we define distribution to be a voltage level of 45kV and below. The distinction is somewhat arbitrary, but picks a point between 69kv which is generally considered a transmission (or at least sub-transmission) level and 21kV which would generally be considered distribution. • It is unrealistic to ask utilities to redefine their cost or reliability reporting on the basis of these definitions. However, a utility that has very different definitions may want to restate these statistics to better compare their performance. • Distribution Voltage Classes • 5kV class (>1kV, <=9kV) • 15kV class (>9kV, <=15kV) • 25kV class (>15kV to <=26kV) • 35kV class (>26kV to <=36kV) • 44kV class (>36kV to <=44kV)
One way to determine whether a substation isTransmission vs. Distribution would bebased upon usage. For multi-purpose substations, you may either segregate costs or assign costsbased upon predominant use. For purposes of this survey, we generally will recommend a low-side definition based upon a 45kV or below as a distribution substation. It is unrealistic to ask utilities to redefine their cost or reliability reporting on the basis of these definitions. We will rely on each utility’s self-assigned definitions. However, a utility that has very different definitions may want to restate these statistics to better compare their performance. Distribution Voltage Classes 5kV class (>1kV, <=9kV) 15kV class (>9kV, <=15kV) 25kV class (>15kV to <=26kV) 35kV class (>26kV to <=36kV) 44kV class (>36kV to <=44kV) Substation Definitions Transmission classes >=45kV • <69kV class (>=45kV <69kV) • 69kV class (>=69kV <100kV) • 100kV class (>=100kV <200kV) • 200kV Class (>=200kV <300kV) • 300kV Class (>=300 kV <400 kV) • 400kV and above Note: We will have transmission-only and distribution-only entities participating in this survey. Undoubtedly their voltage levels will not necessarily line-up with the above definitions.
Because our benchmarking is done at a relatively high level, we want to include transmission substations that have auto-transformers, but not AC/DC converter stations. While these components aren’t all directly measurable, nor are the MVA calculations comparable, we want to recognize the existence of these units of property to make the benchmarking as comparable as possible. Customer-owned or dedicated substations are an issue in making comparisons. If customers own and maintain their own stations, the reporting option for this questionnaire is clear – please exclude both the O&M costs and the capacity for those stations. In the event that you maintain one or more customer-owned stations, the answer may be different. The preferred approach to responding to this portion of the questionnaire is to exclude the costs of the customer-owned stations, and exclude the capacity as well. However, if you cannot practically exclude them, then be sure that both the O&M costs and the capacity are included in all your answers. Small, pole-mounted mini-substations (e.g. transformers, protective devices and a switch) should not be counted as substations. Substation Definitions (cont.)
Generally speaking, we want to measure transformers by MVA rating at normal operating conditions. Since utilities have different operating conditions and different manufacturers have different ratings, we will rely on each utility to report their own conditions. Use the number you report in FERC Form 1. We recognize that autotransformers may have a different set of conditions and that the comparison is imprecise, however, we think this is a better solution than leaving them out entirely. Substation Transformer Nameplate rating
System Activity Section • This section of the questionnaire is designed to identify work load drivers associated with activity. • There are a variety of questions designed to understand the amount of capital activity and that ask for capital unit additions • Other questions ask about selected O&M activities for the year. • The goal is to understand the major drivers of work, not to capture all of the individual work activities. • The questions are separated into Distribution Lines, Substations, and Transmission Lines
Customer density Customers Per Square Mile Customers Per Distribution Circuit Mile Density provides clues regarding environment and system configuration Questions ST5, ST30, Page 3 Questions ST5, ST35, Page 4
Mobile Spare Transformers as % of Total Distribution Mobile Spares Transmission Mobile Spares Not surprisingly, there are many more companies with Distribution mobile spares than Transmission mobile spares Question ST90, Page 15 Question ST95, Page 17
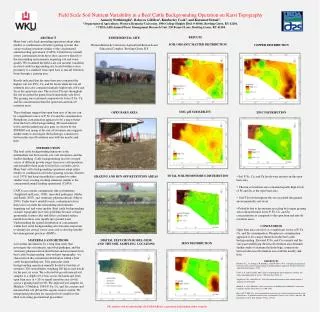
Pole Treatment Choices Distribution Poles Inspected/Treated Transmission Poles Inspected/Treated There’s a significant difference in the inspection/treatment approach for Distribution versus Transmission poles. At an average of about ½% replaced per year, the life-cycle appears long. Question SA20, Page 10 Question SA65, Page 29
Issues found: Distribution System Activity The data provided to date appears reasonably accurate. We could use some additional data in a few areas.
Financial – Overview of the Cost Model Working with an adjusted FERC model and the Activity-Based Cost Model
Financial Section Overview • The Financial sections of the questionnaire (Sections DF and TF) ask for the costs of running the business, separated into Capital and O&M costs. We also further ask companies to allocate costs to Substations. There are two alternative cost reporting systems: • FERC: The overall cost model is based on the FERC system of accounts, with a number of adjustments designed to make the cost reporting more consistent between the companies. Specific questions within the questionnaire ask for the data reported in individual FERC accounts, and then subsequent questions ask for the information required to make the desired adjustments. • ACTIVITY-BASED: The guiding principle of the activity cost model is to capture the expenditures associated with the year in which they were made, regardless of when they were actually reported to FERC. The activities also are more aligned with typical budgetary categories, such as New Business (capital) and Vegetation Management (O&M). While budget categories differ among utilities, we have developed a generic budget categories that most companies have been able to use. • The Financial Section also covers assets reported to FERC, separated by Distribution and Transmission. We also ask companies to allocate assets between lines and substations. Construction Work In Progress (CWIP) is also covered in this section.
FERC: Specific Adjustments • The following page is a schematic of how basic FERC cost data will be adjusted for this benchmarking study. • A&G costs will be excluded – Utilities are asked to adjust their costs to exclude costs typically reported as A&G (e.g. pensions and benefits) from their O&M data. • General plant costs will be excluded – Utilities are asked to adjust their costs to exclude costs typically reported as General Plant (e.g. IT/Communications infrastructure) from their T&D Capital data. • Other T&D Capital exclusions: • Transmission: Land acquisitions and extraordinary items • Distribution: Land acquisitions, street lighting and extraordinary items • Other O&M exclusions: • Transmission: Wheeling, Rents/Leases, IT costs, extraordinary items. If you charge IT support to account 569, you should exclude it. Regional Market Expenses (Accts 575, 576). • Distribution: Streetlight Maintenance, Rents/Leases, IT costs, extraordinary items. If you charge IT support to Distribution O&M accounts, you should exclude it. • If you normally charge R&D, such as EPRI dues, to O&M, include it, unless it is an unusually large amount for this year • Substation costs will be allocated from Transmission and Distribution accounts, and similar adjustments made. • The goal of the exclusions is to provide a fairer comparison of T&D operational performance, by excluding certain costs that relate to demographic differences not under the control of T&D management.
FERC: The ADJUSTED FERC COST MODEL FERC provides a general framework • Certain costs must be excluded to provide fair comparisons that focus on operations • Substation costs must be separated out, including certain allocations Substations
Do not include land acquisition costs or rents/leases. Although less common for distribution, land acquisition costs vary greatly by region and also can occur at very different points in time, based upon land policies. Similarly, rents/leases are an alternative to ownership and have some of the same shortcomings from a benchmarking perspective. Do not include street lighting capital or expense costs. There is a large variation of what street lighting exists in a service territory and what percent is owned and operated by the incumbent utility. Do not include extraordinary items. These can run the gamut and should be identified individually. Storm costs should be excluded if they are outside your “normal” experience. This is to account for the fact that some utilities utilize an “insurance reserve”, so that extraordinary storm expenses are charged to the “reserve” account, and are not “O&M” expenses. If your utility uses an “insurance reserve” account, you do not need to make any adjustment. FERC: Rationale for Exclusions - Distribution
FERC: CIAC 2. Electric Plant To Be Recorded at Cost. A. All amounts included in the accounts for electric plant acquired as an operating unit or system, except as otherwise provided in the texts of the intangible plant accounts, shall be stated at the cost incurred by the person who first devoted the property to utility service. All other electric plant shall be included in the accounts at the cost incurred by the utility, except for property acquired by lease which qualifies as capital lease property under General Instruction 19. Criteria for Classifying Leases, and is recorded in Account 101.1, Property under Capital Leases, or Account 120.6, Nuclear Fuel under Capital Leases. Where the term cost is used in the detailed plant accounts, it shall have the meaning stated in this paragraph. B. When the consideration given for property is other than cash, the value of such consideration shall be determined on a cash basis (see, however, definition 9). In the entry recording such transition, the actual consideration shall be described with sufficient particularity to identify it. The utility shall be prepared to furnish the Commission the particulars of its determination of the cash value of the consideration if other than cash. C. When property is purchased under a plan involving deferred payments, no charge shall be made to the electric plant accounts for interest, insurance, or other expenditures occasioned solely by such form of payment. D. The electric plant accounts shall not include the cost or other value of electric plant contributed to the company. Contributions in the form of money or its equivalent toward the construction of electric plant shall be credited to accounts charged with the cost of such construction. Plant constructed from contributions of cash or its equivalent shall be shown as a reduction to gross plant constructed when assembling cost data in work orders for posting to plant ledgers of accounts. The accumulated gross costs of plant accumulated in the work order shall be recorded as a debit in the plant ledger of accounts along with the related amount of contributions concurrently be recorded as a credit. The actual expenditures, on the other hand, may or may not be net, depending on how the company accounting works. When the company issues an invoice for the contribution, it should credit to the plant accounts when the invoice is issued, whether or not the invoice is ever collected, so the actual expenditures should also be net, unless they don’t issue the invoice timely. I believe that the way most companies do it, and the prudent business practice, would be to issue the invoice, and maybe collect it, before construction begins.
FERC: Distribution Capital Adjustments Each portion of the financial section asks for the key FERC accounts, and then asks for the information necessary to make the adjustments. In the figure below (taken directly from the questionnaire), the blue arrow highlights the value to insert for the exclusion, if it isn't already clear. As noted on the preceding page, FERC costs are net of CIAC.
FERC: Distribution O&M Adjustments For Distribution Line O&M expenses, the Substations expenses need to be removed from the overall Distribution expenses (shown with the blue arrow). Then individual exclusions are identified as well.
ACTIVITY-BASED Cost Model • While FERC has the benefit of being a uniform system of accounts, there are several important shortcomings: • FERC capital spending lags behind actual spending; costs for large projects go into a Construction Work in Progress (CWIP) account and are not transferred until the assets are placed into service, sometimes a several year lag. • FERC capital accounts generally follow plant accounts and units of property (e.g. poles, towers, and fixtures) – not the typical reasons why utilities spend (e.g. new business) • FERC O&M accounts tend to be more activity-oriented, but do not necessarily track important categories (e.g. vegetation management) • For those reasons, a simplified Activity- Based Costing system was developed to get current year spending by activity. The following diagram depicts the Activity-Based approach
Activity-Based Cost Model • Transmission Line Capital • Serve New • Expand • Sustain • Other • CIAC • T&D Substation Capital • Serve New • Expand • Sustain • Other • CIAC • Distribution Line Capital • Serve New • Expand • Sustain • Other • CIAC • Transmission Line O&M • Sustain the Network • Operate the Network • T&D Substation O&M • Sustain the Network • Operate the Network • Other • Distribution Line O&M • Sustain • Other The activity-based cost model breaks the expenditures into capital and O&M, and then splits them into the activities shown on the process model introduced above. The following 3 pages provide more details of the individual activities for Transmission, Substations, and Distribution.
Activity Based Costs – Distribution Lines • Distribution Line Capital • Serve New: Extension to new distribution customers • Expand: Capacity Additions (adding additional lines, increasing capacity of existing lines) • Sustain: System improvement (reliability/efficiency including distribution automation, feeder hardening, worst circuits, etc.) • Sustain: Replace/Repair in kind (not including meters & transformers) • Sustain: Service Restoration • Sustain: Line Relocations • Sustain: Distribution Operations Center • Sustain: Meter Purchases (including AMS investment) • Sustain: Transformer Purchases • Other • CIAC • Distribution Line O&M • Inspection & Maintenance (planned or unplanned not associated with service restoration) • Vegetation Management • Service Restoration • Distribution Operations Center • O&M associated with capital work • Engineering/Design O&M (Planning studies, standards, mapping) • Damage Prevention/Facility Locating • Field Switching • Meter Expenses (O&M) • Transformer Expenses (O&M) • Other • Almost all of O&M is considered to be work designed to “sustain the network” or “operate the network”. • Capital work is split among adding new customers, expanding the system, and sustaining the network
Activity-Based: Distribution Capital Activities • In order to better understand your capital spending, we ask that the capital figures be allocated in accordance with a specified list of activities. • The total capital activity is intended to be the amount actually spent during the year, not necessarily what was reported to FERC (and not necessarily the “adjusted FERC capital” reported in this survey); we believe that this eliminates some of the perturbations caused by changes in CWIP accounts.
Activity-Based: Distribution O&M • As is done with Capital, we ask that the O&M figures be allocated in accordance with a specified list of activities. • Unlike Capital, we expect the O&M Expense should equal the amount reported as “Adjusted FERC”
Distribution Assets The last series of questions in the Distribution Financial section asks about the FERC account values for the existing assets. These values are needed in order to determine asset replacement rates
Data issues in cost figures Distribution Line O&M + Capital per Customer This chart shows missing values for capital for 2 companies Question DF20, page 3
Outliers – examples for Investigation Vegetation Management Expense Per Structure Mile Trimmed O&M Per Asset Questions DF60, SA22, Page 16 Questions DF20, DF70, Page 14
Data Validation – Activity versus FERC Capital FERC vs Activity-Based Capital Additions Timing of job close-out should explain the differences between FERC-reported and Activity-based capital additions. Questions DF%, DF50, Page 46
Activity-Based Capital Costs Activity-Based O&M per Asset Activity-Based Capital Additions per Asset Questions DF50, DF70, Page 25 Questions DF60, DF70, Page 35 We appear to have had reasonable success with the refined set of capital and O&M activities in reducing the “other”, while most companies could allocate spending in almost all the categories of activities
Practices Vs. Initiatives • For our purposes: • Practices are activities, programs or processes that have been around for a while. For these, sufficient time has passed in which to assess their success or failure. We mostly ask about practices that have proven successful in accomplishing a specific goal. • Initiatives are new activities, programs or processes that have been enacted recently with the goal of improvement. These are so recent (1 to 2 years) that insufficient time has passed in which to assess their success.
Distribution Practices • This section is organized around the following topics: • Distribution Automation – A very brief section with a couple of questions about distribution automation and smart grid initiatives and goals • Metering – a section asking status of smart metering, impacts in storm response, and uses of the information from the smart meters • Asset Management – organizational role, regulatory drivers, software tools, pole and cable management • Quality Management – One question about quality management approaches in use • Network Expansion – These questions focus on design software, standards, construction and construction productivity • Sustain Network – These questions focus on vegetation management, including trim cycles, improvement initiatives, and contracting structure • Replacement Planning, Execution – This section covers maintenance activities, crew sizes, grid hardening and resiliency • Distribution Operations Center – This covers several items about improvement initiatives, Advanced DMS • Distribution Customer Satisfaction and Customer Experience – A few questions asking for JDPower scores, and a little bit about Customer Experience initiatives
Distribution Practices Part 2 – New Business • This section is organized around the following topics: • New Business - This covers customer contributions, which are defined as work performed, materials contributed or payments. We ask who does various parts of the work of installations, and a few on performance measurement • Cost and Staffing Approaches – This section provides a few new business scenarios and asks who does the work (utility or contractor/developer), and asks a second question asking for detailed cost breakdowns for the scenarios. • Crew Sizes and vehicles – This section asks for crew sizes, makeup, and vehicle support for each of 4 new business scenarios
Meter Reading Approaches Question DP40, Page 11 For the first time in our group, fewer than half of the meters (from reporting companies) are manually read watt-hour meters.
Thank you for your Input and Participation! Your Presenters Ken BuckstaffKen.Buckstaff@1QConsulting.com310-922-0783 Dave Canon Dave.Canon@1qconsulting.com 817-980-7909 Dave Carter Dave.Carter@1qconsulting.com 414-881-8641 Debi McLain Debi.McLain@1QConsulting.com760-272-7277 Tim. SzybalskiTim.Szybalski@1QConsulting.com 301-535-0590 About 1QC First Quartile Consulting is a utility-focused consultancy providing a full range of consulting services including continuous process improvement, change management, benchmarking and more. You can count on a proven process that assesses and optimizes your resources, processes, leadership management and technology to align your business needs with your customer’s needs. Visit us at www.1stquartileconsulting.com | Follow our updates on LinkedIn Satellite Offices Corporate Offices California 400 Continental Blvd. Suite 600El Segundo, CA 90245(310) 426-2790 Maryland 3 Bethesda Metro Center Suite 700Bethesda, MD 20814(301) 961-1505 New York | Texas | Washington | Wisconsin